Choose where to build next
Use the street colours to find places that need better transport. Use the map layers to check your routes, stations and services.
Find places that need transport
Turn on Demand streets to see where people need to travel. Coloured streets show trips that start or end nearby. These include travel between homes, workplaces, schools, shops and other places.
Red is the strongest demand in this city. Orange and yellow show medium demand. Green shows little, and grey shows none.
A red street does not guarantee a busy line. Connect it to places people want to reach. Your service must also be fast and frequent enough for them to choose it.
Find the places people travel to
In Berlin and Amsterdam, demand streets include trips arriving at workplaces. A work district can have strong demand even when few people live there.
Turn on Places to find destinations such as schools and shops. Use City requests to see areas that need better transport.
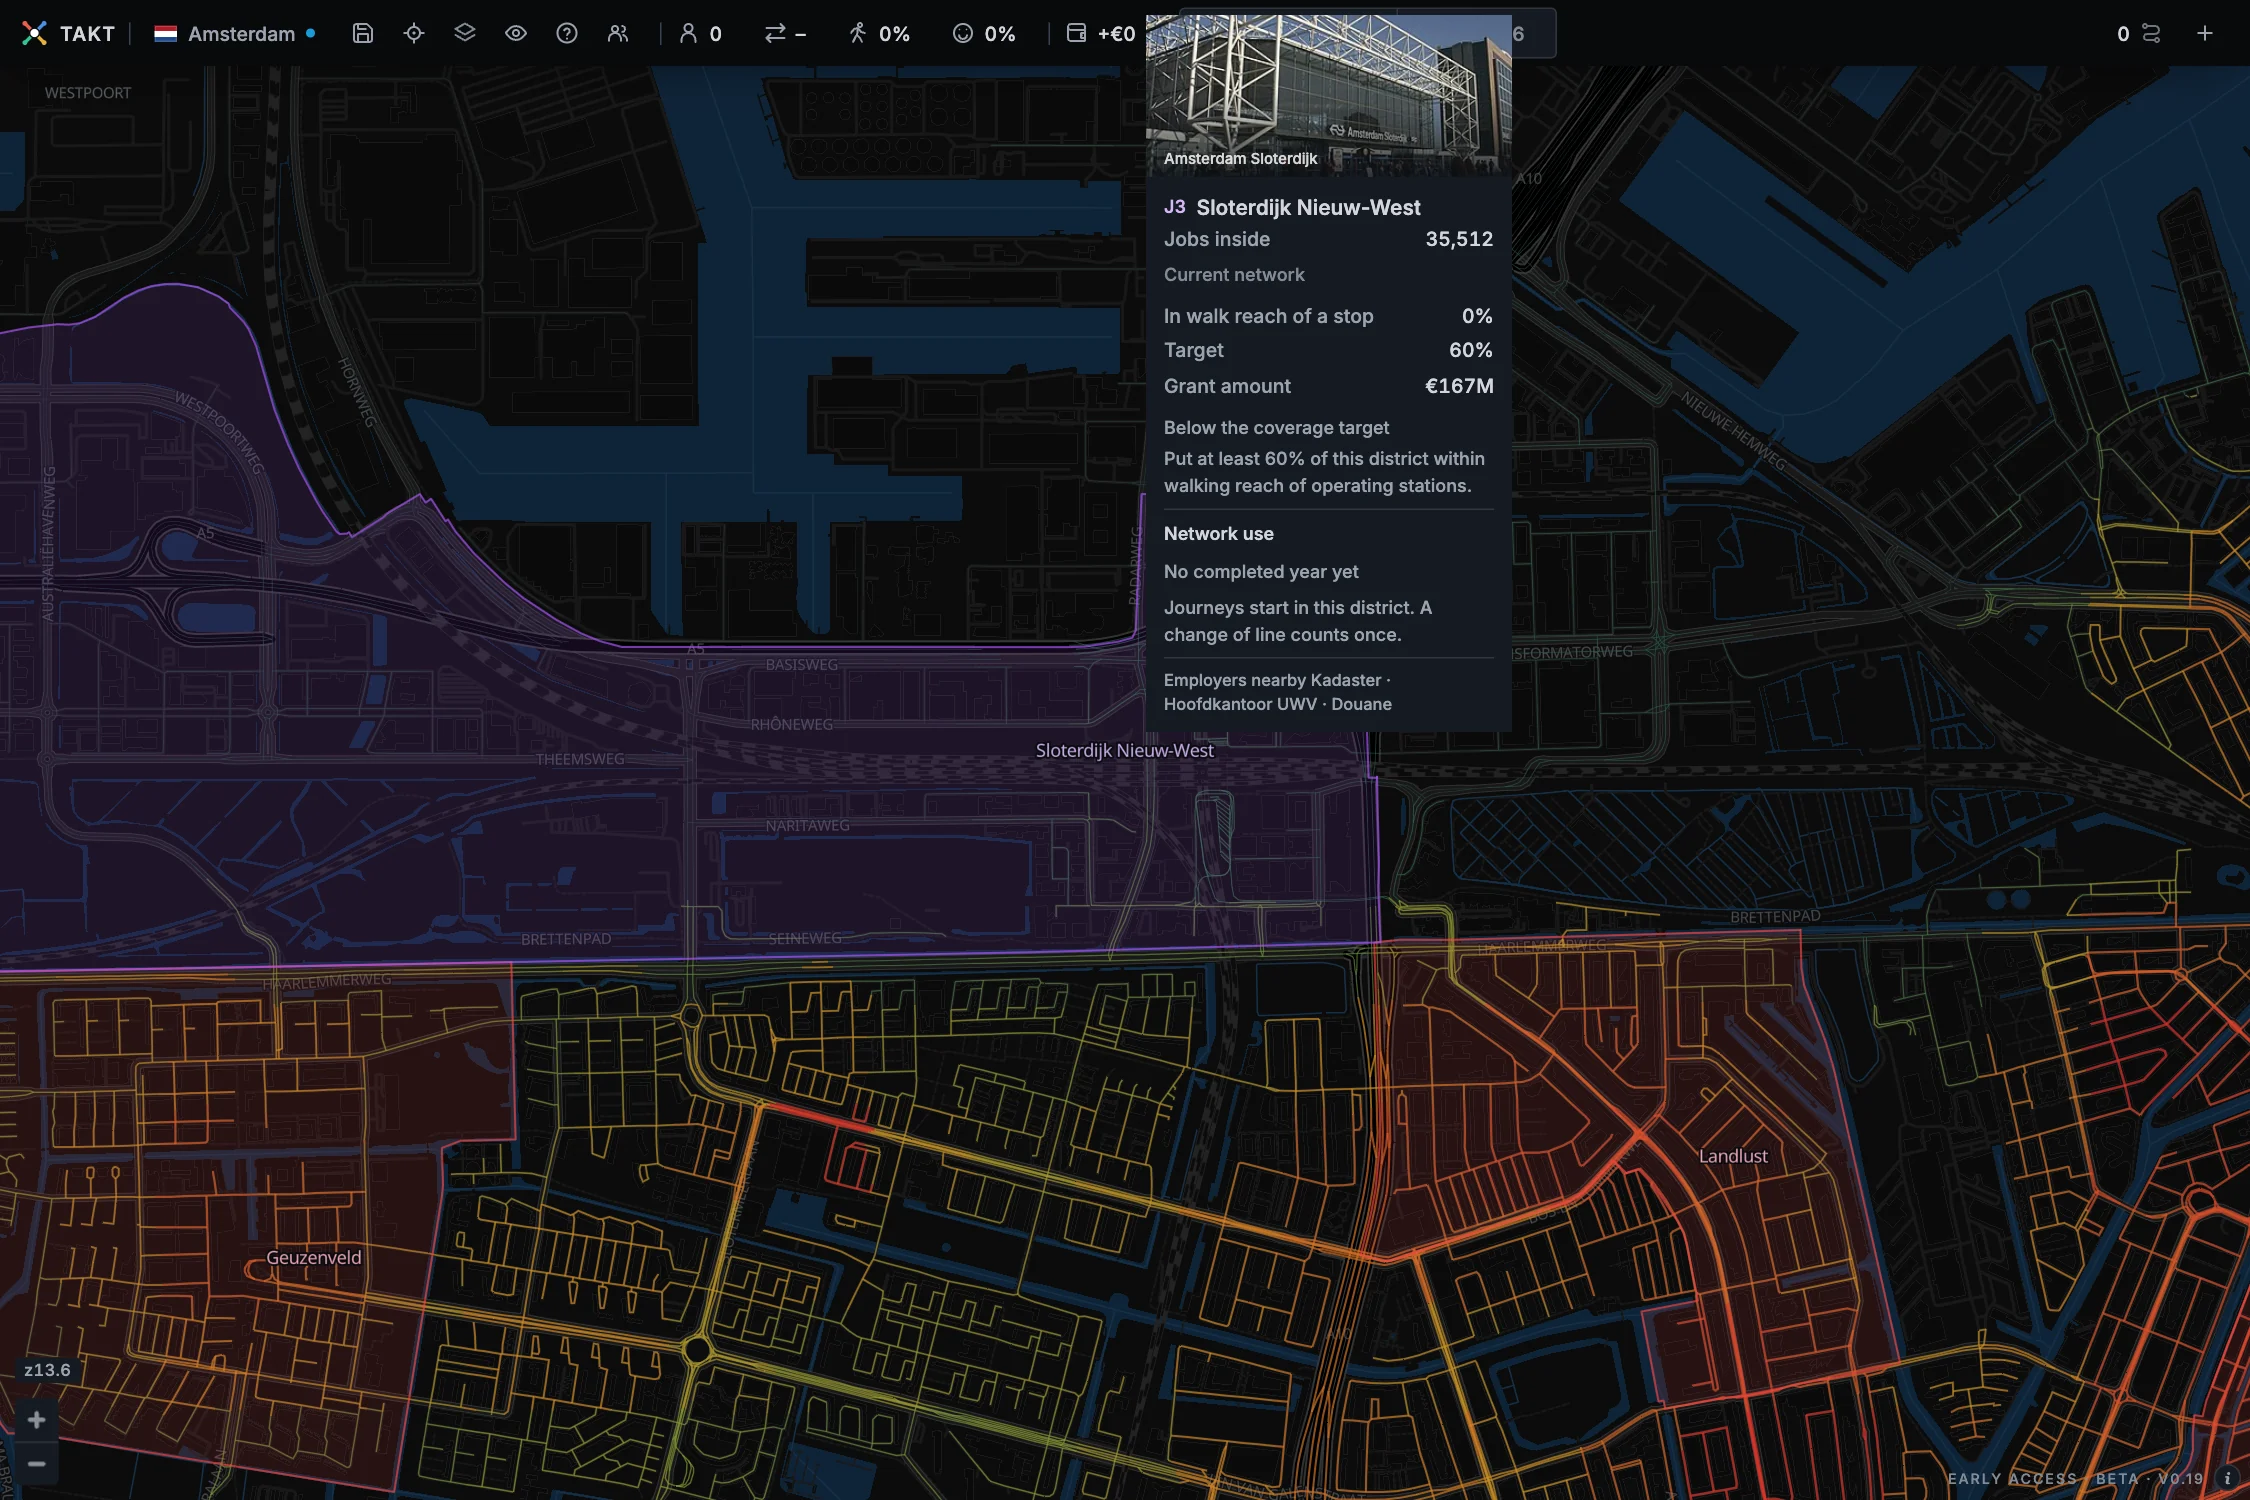
See where your network already helps
Street colours fade as your network carries more trips in that area. A faded street can mean that your services already meet much of its demand.
The colours show the last completed year. Finish the next year to see the effect of your changes.
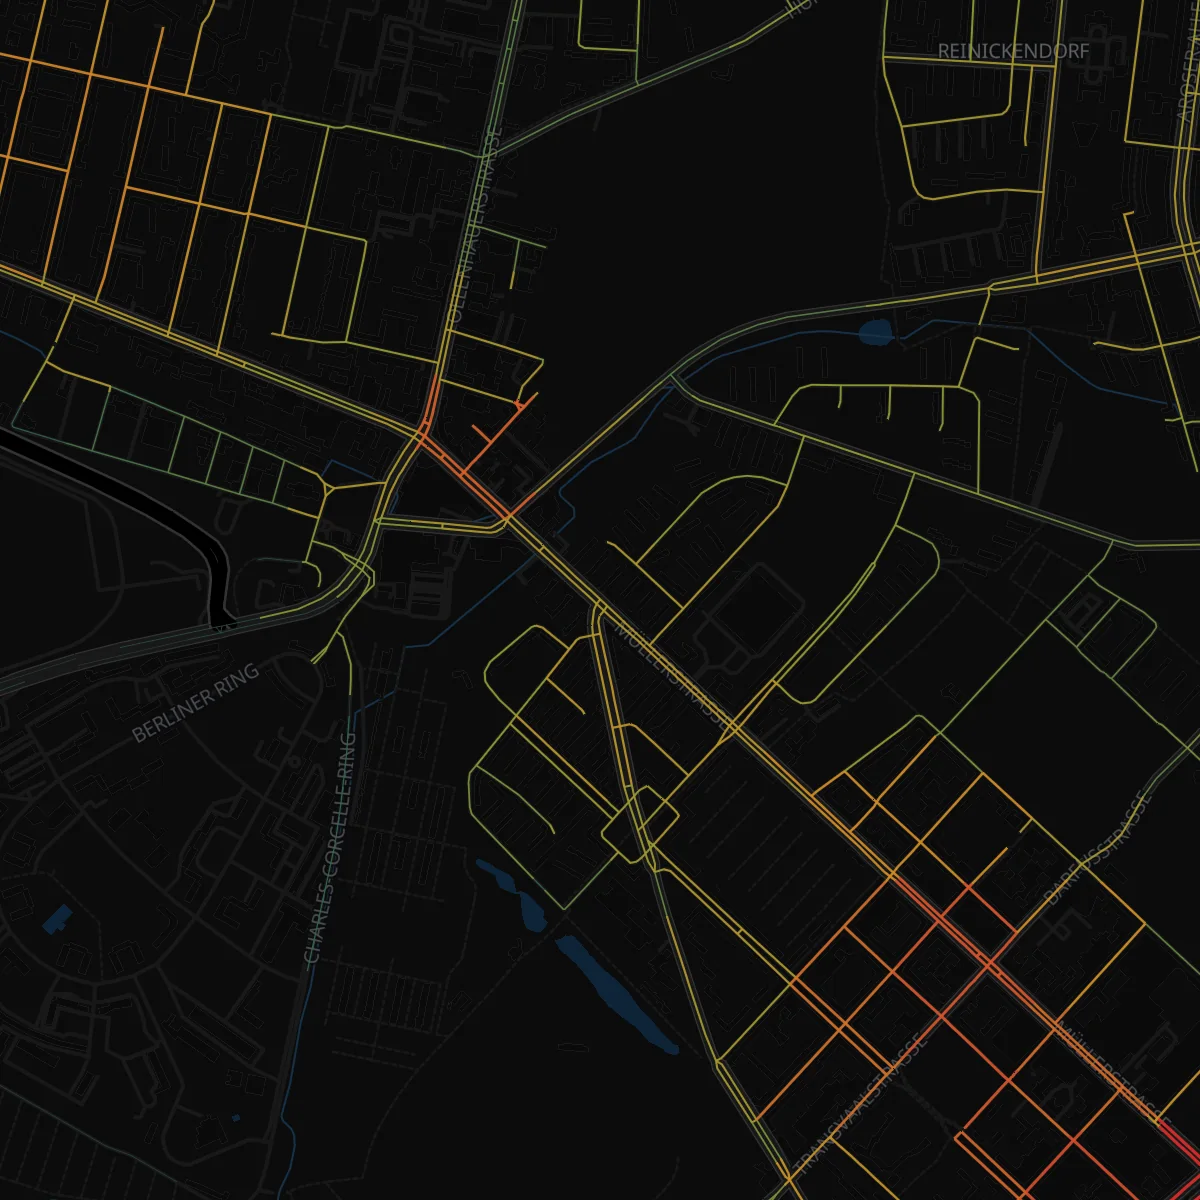
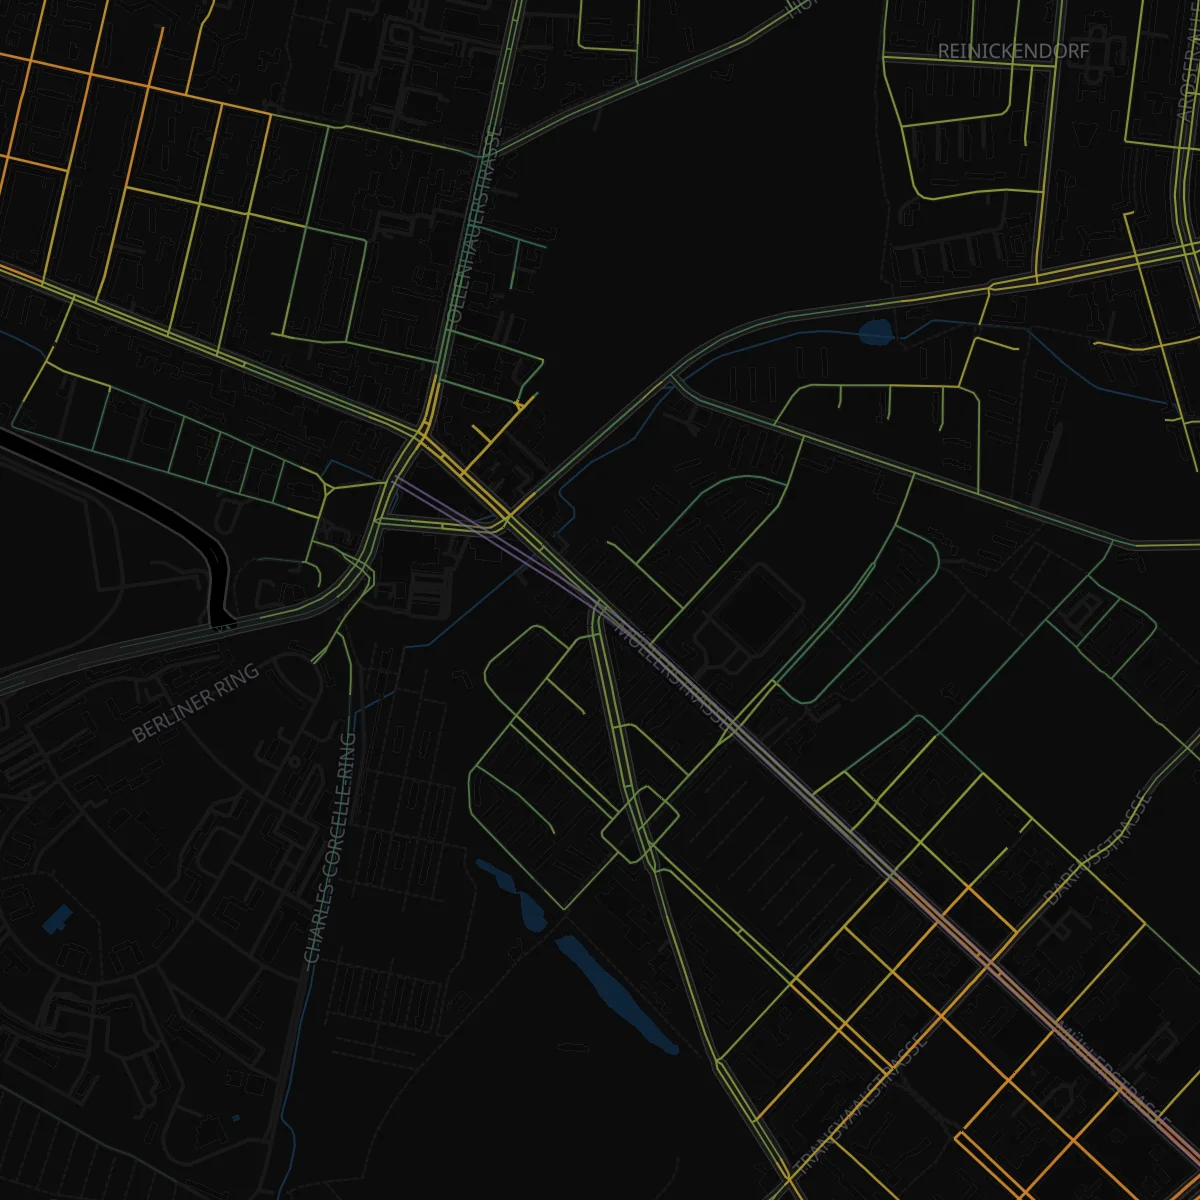
Look for bright streets beyond the areas you already serve when planning your next line.
Choose what the map shows
Open the layer drawer in the top bar. Its switches are grouped under Stations, Lines and City.
Click a group heading to hide or show its switches. Hiding the switches does not turn them off.
Takt remembers your choices. Changing a layer only changes what you see.
| Your question | Use these layers |
|---|---|
| Where are the tracks and platforms? | Construction |
| Which services run here? | Network view |
| Where is better transport needed? | Demand streets |
| What brings people here? | Places and City requests |
| Which stops matter most? | Station loads and Key stations |
| Where are services crowded? | Line loads |
| Where are services slow? | Speed |
| How often does a line run? | Frequency |
| Which connections need attention? | Station transfers |
| Can more trains use this track? | Track capacity |
| What is moving? | Vehicles and Live traffic |
Station loads show daily boardings. Key stations show the stops that bring the most riders onto each line.
Use one line view at a time. Selecting another view replaces the current view. Clicking the current view again hides the routes.
Station markers, Station names and Vehicles have separate switches. You can show station names without markers, or markers without names.
Live traffic shows car trips from the last completed year. It excludes freight and traffic passing through the city.
See tracks and platforms
Select Construction under Lines to see tracks, tunnels, bridges and platforms.
Use this view to inspect what you have built and what you plan to build.
Platforms follow the curve of the track. Platforms that lie side by side or cross each other share one station hall with a glass roof. Vehicles run under it.
New parallel track belongs to the line that builds it; the source line keeps its own rails. Older unused-track leftovers are removed when a game opens.
Follow your lines in Network view
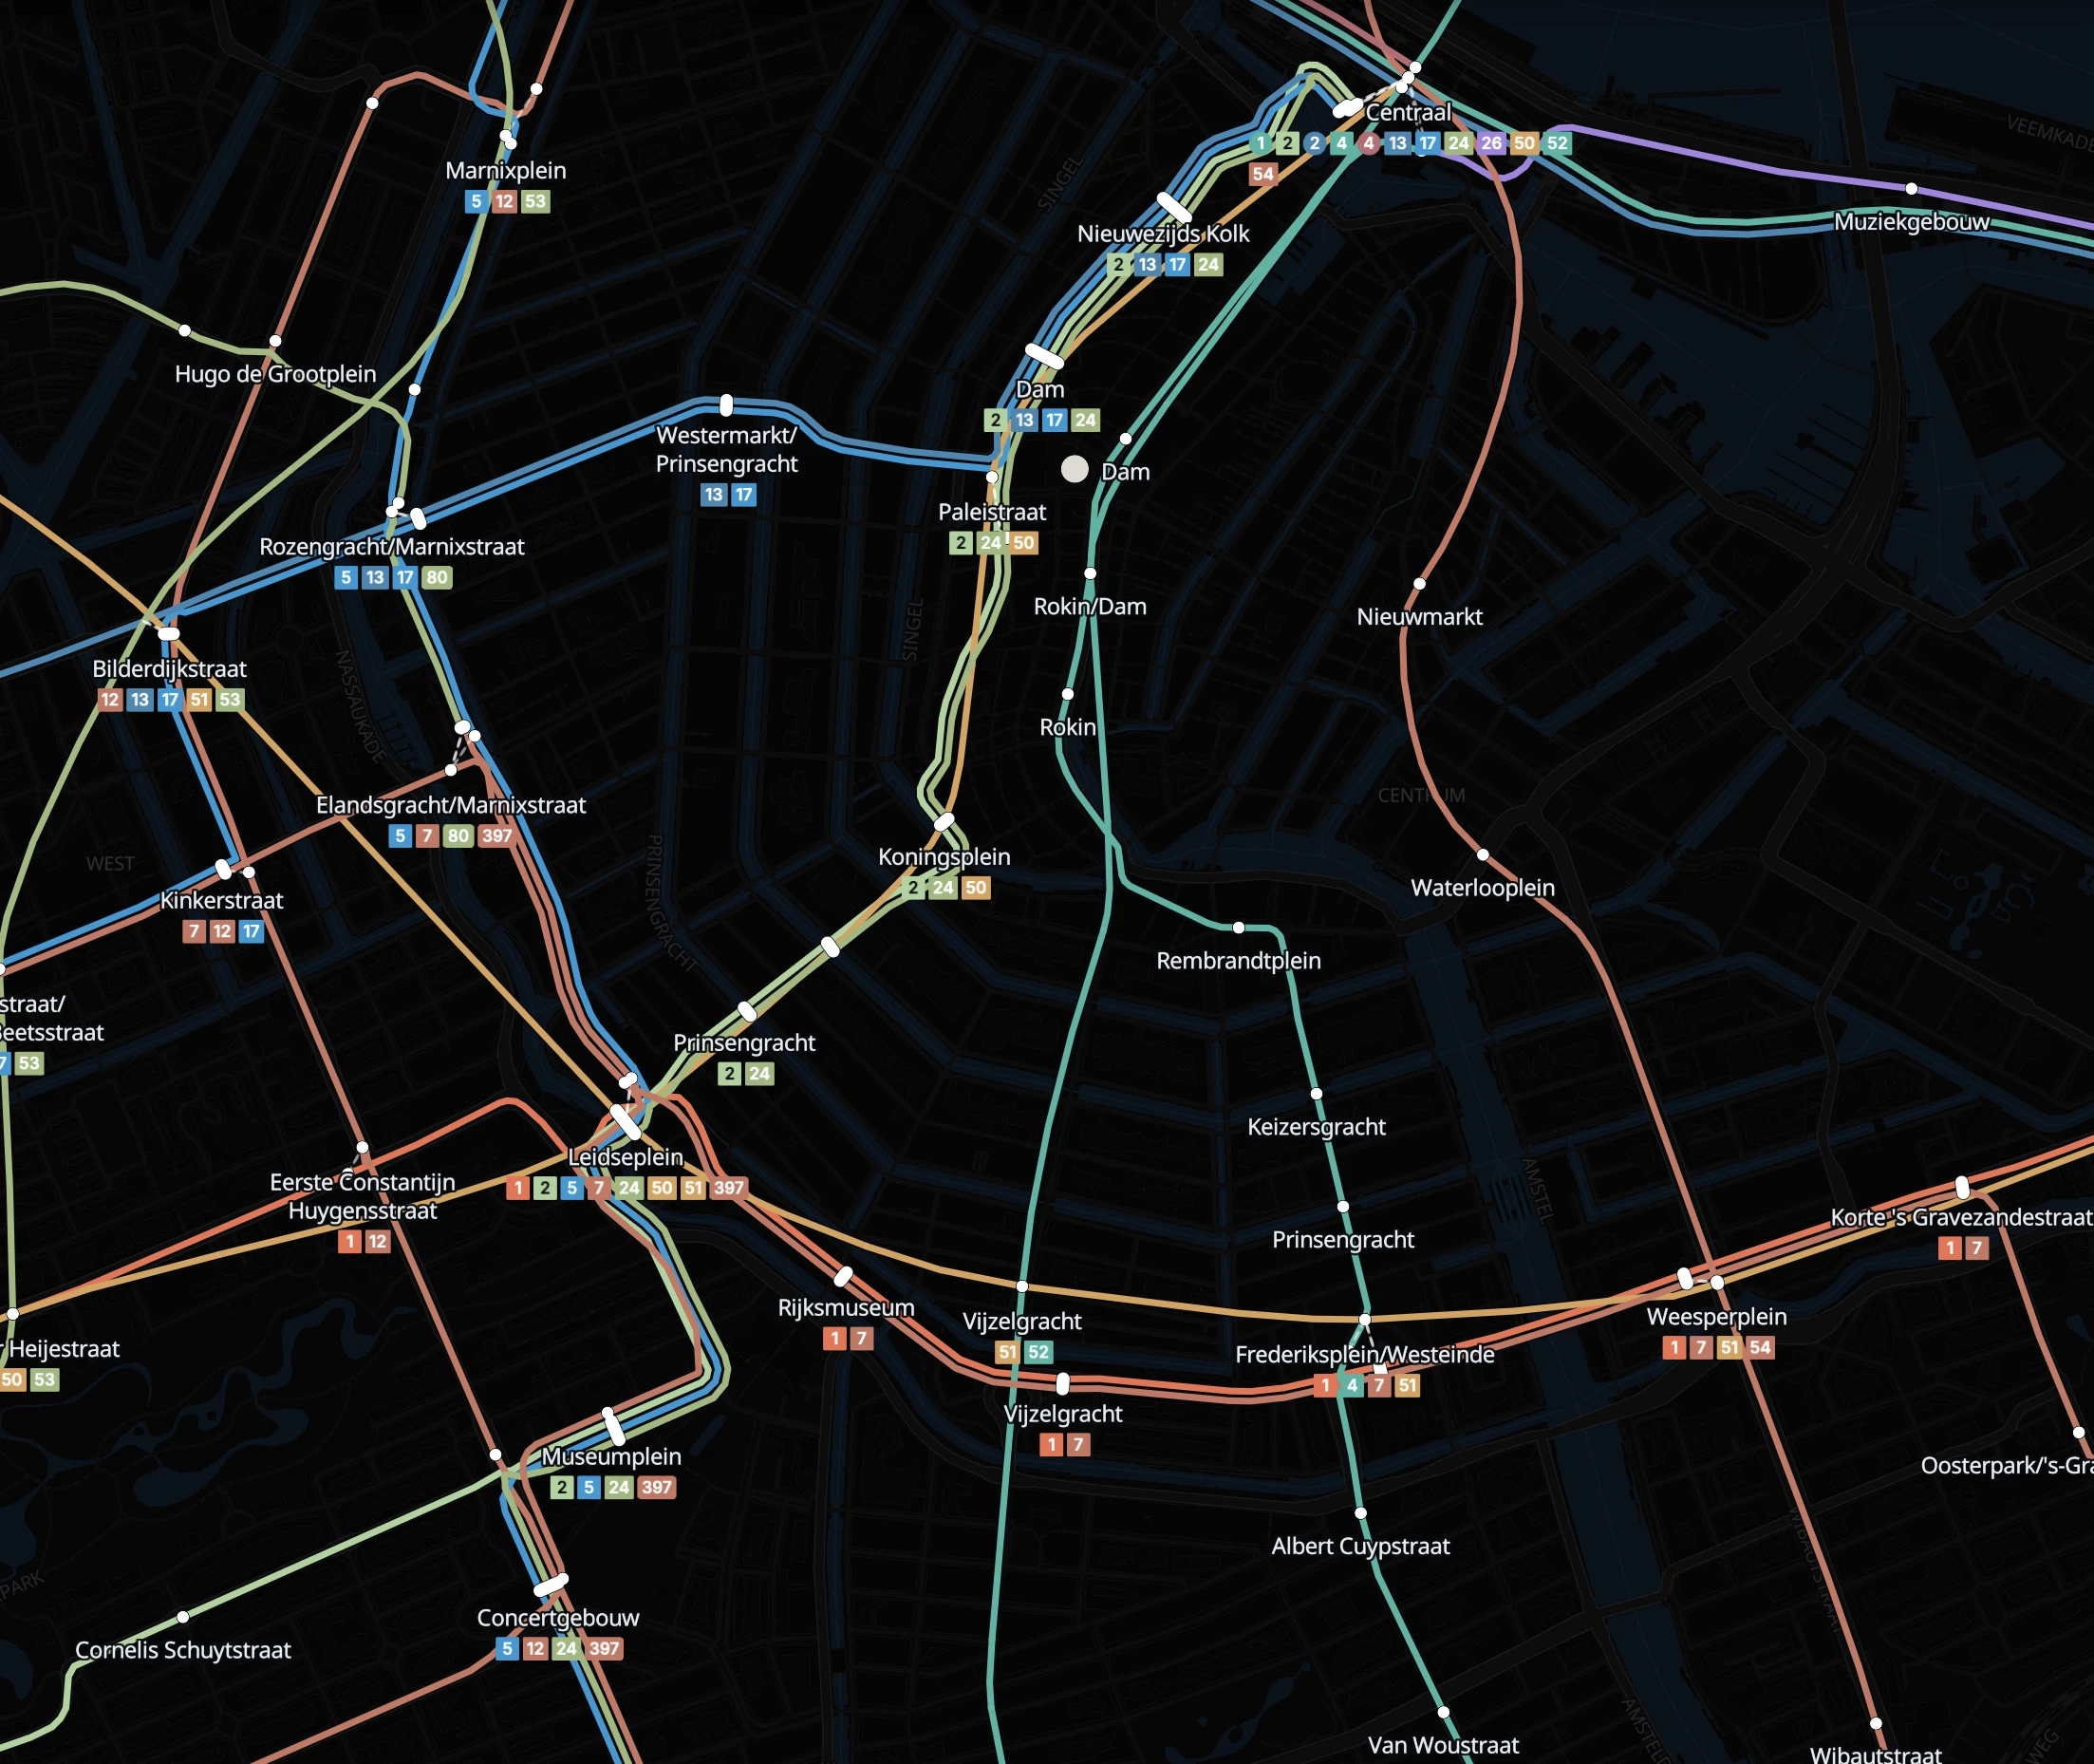
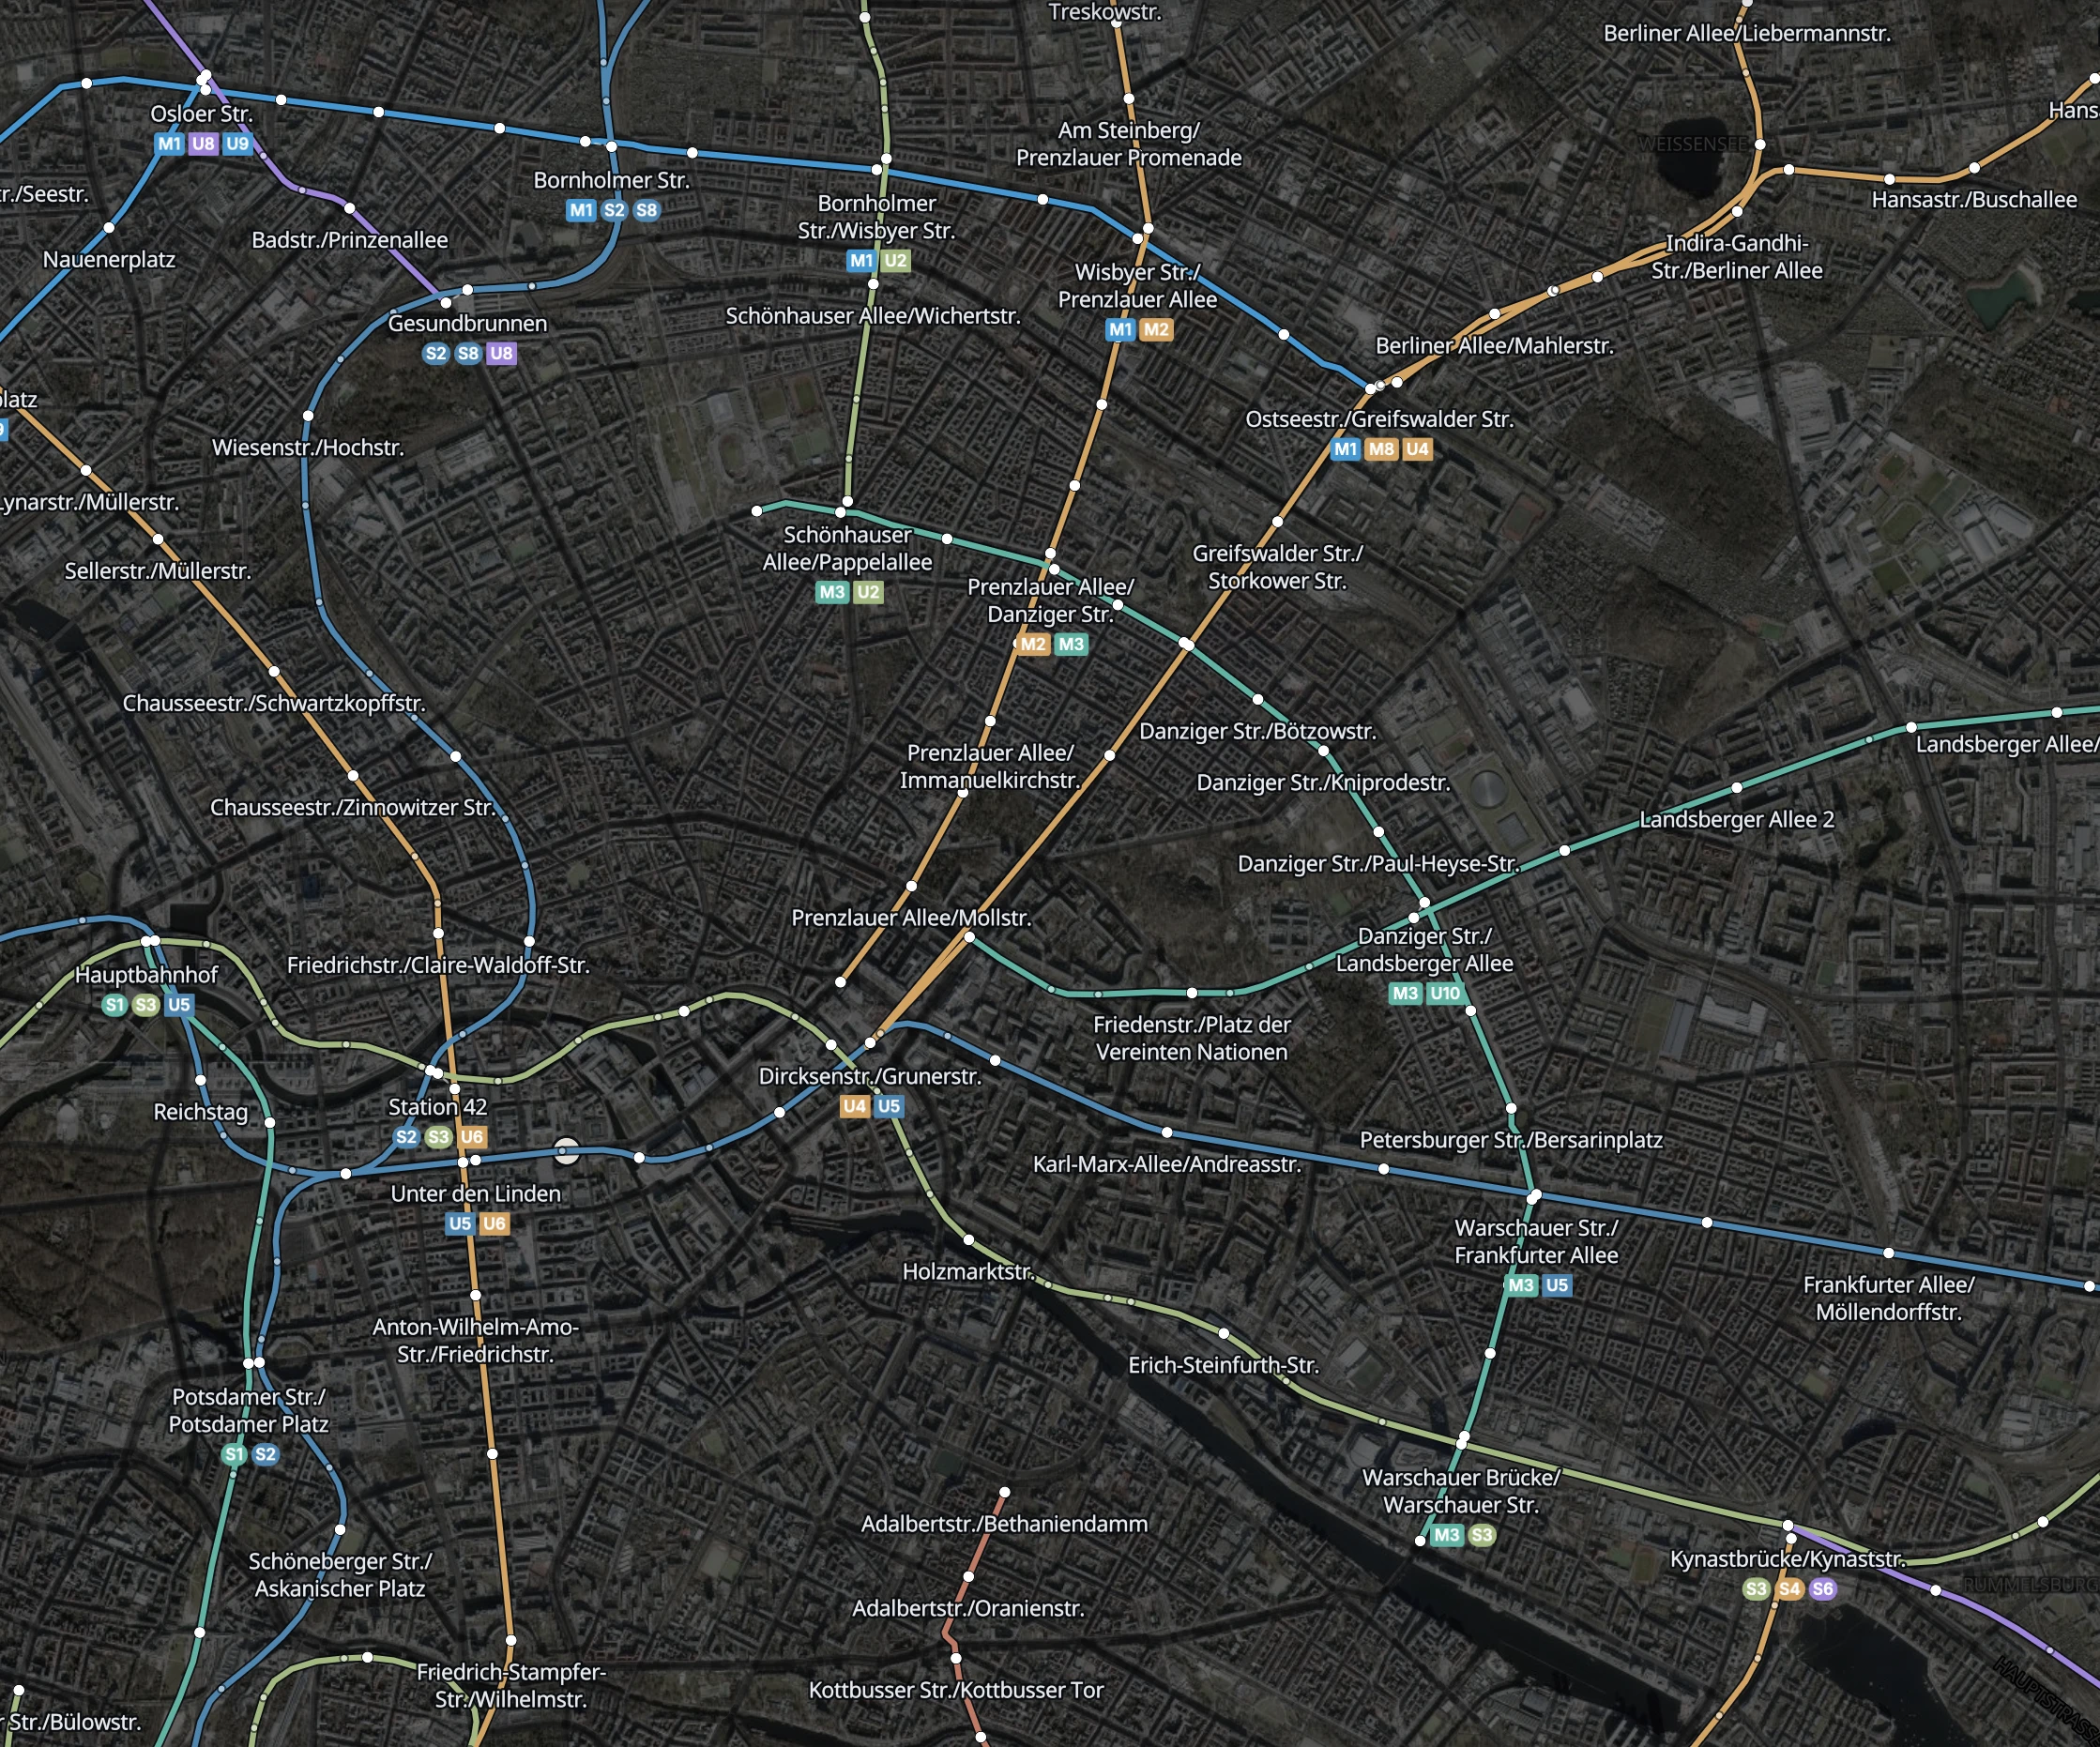
Select Network view under Lines to see your services as a transit map. Turn on Station markers and Station names to see stops and line badges.
Each line keeps its colour. Lines use equal widths and appear beside each other on shared sections, so you can follow each service.
The space between colours helps you read the map. It does not mean that you have built separate tracks. Nearby parallel routes can also separate visually.
Planned sections use dashed strokes. Switching views does not change tracks, services or passenger results.
Read station markers and badges
White markers show stations. A longer marker connects the displayed lines at an interchange.
While building, the coloured ring and your selected line's station dots stay visible above the interchange marker. The ring identifies the station your next click uses.
Badges below a station name show the visible services that stop there. A service that only passes through does not get a badge.
Zoom in if names or badges are missing. Interchanges show badges first. At close zoom, separate interchange platforms can show their own labels.
Select a line from its badge
- Hover over a badge to see the line name and the next click's action.
- Click the badge to open that line's card.
- Click the selected line's badge again to show only that line.
Badge clicks keep Network view open and do not start construction. Use the line-list visibility controls to show other services again.
Choose the background and detail
Station names controls names and badges. Station markers controls the white station shapes. You can use either switch separately.
Turn off Demand streets to remove the demand colours behind your routes. Network view also works on satellite imagery.
Find the crowded sections
Select Line loads to find crowded sections. Each section shows its highest passenger load from the last completed year.
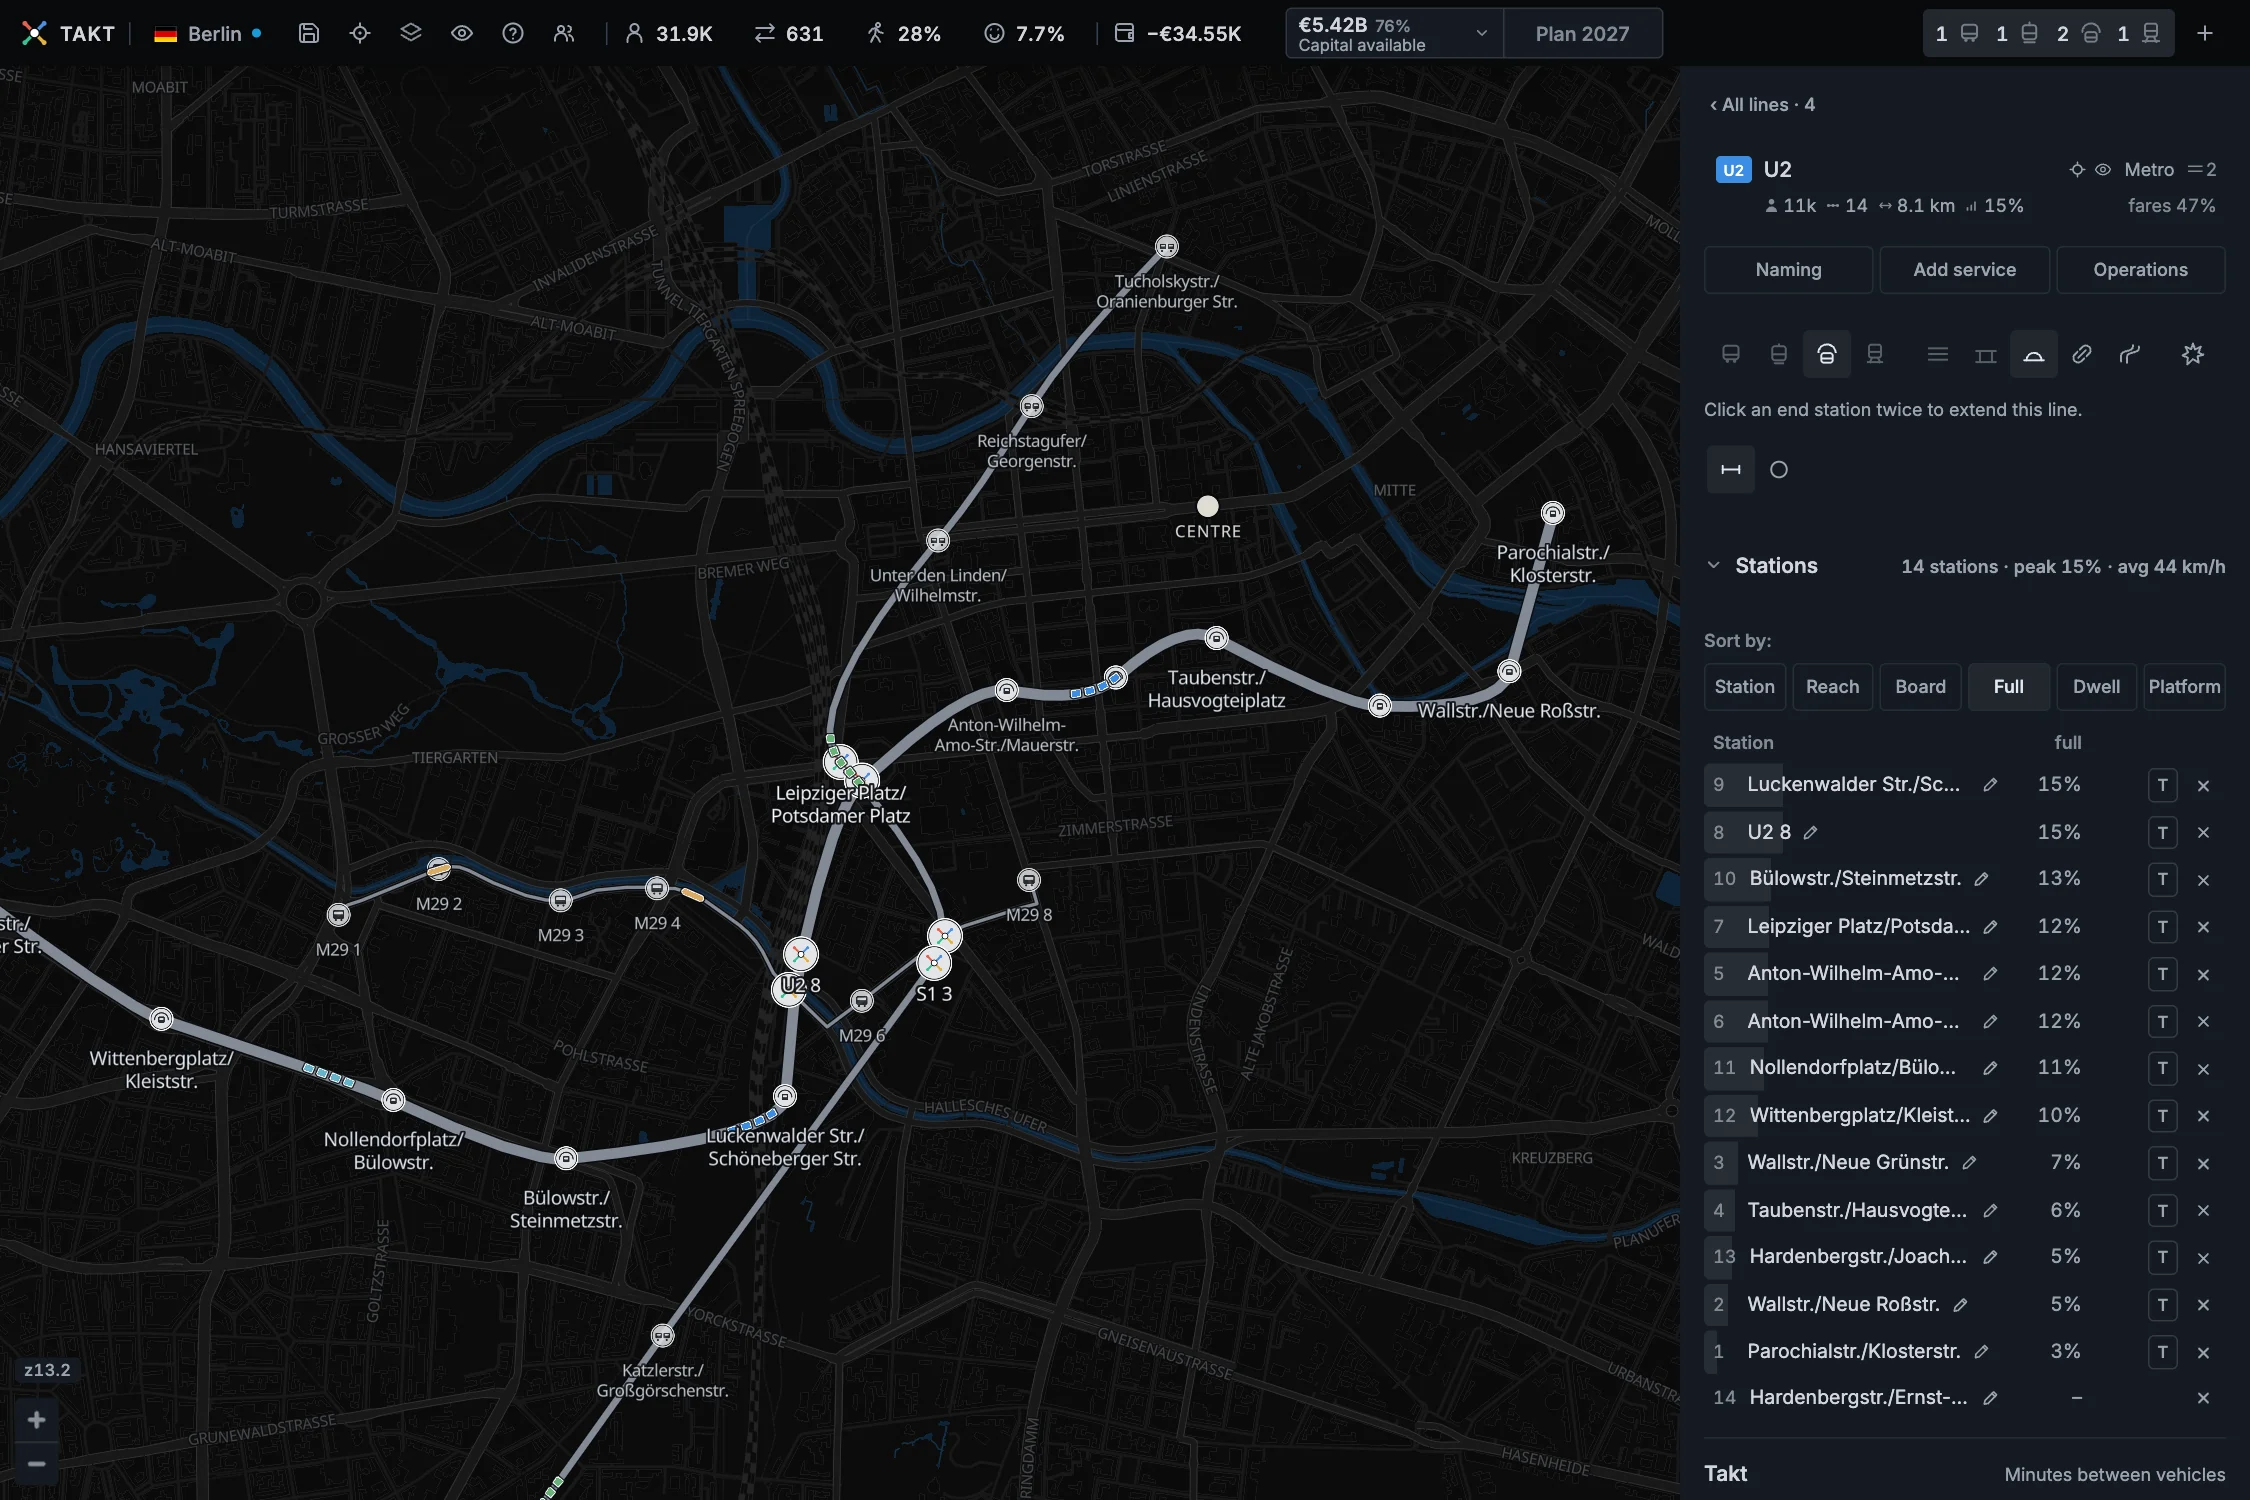
| Colour | Highest load | Meaning |
|---|---|---|
| Grey | Up to 85% | Vehicles still have room at the busiest time. |
| Amber | Above 85%, up to 100% | The section is close to full. |
| Red | Above 100% | More passengers want to travel than the service can carry. |
Amber and red sections appear thicker. Hover over a section to see its line, the stations at each end and its percentage.
Each section shows its busiest time and direction. Two red sections can be busy at different times of day.
Sections without a result, including new planned sections, have no percentage.
Select Construction to see tracks, tunnels, bridges and platforms again.
Find the busy stations
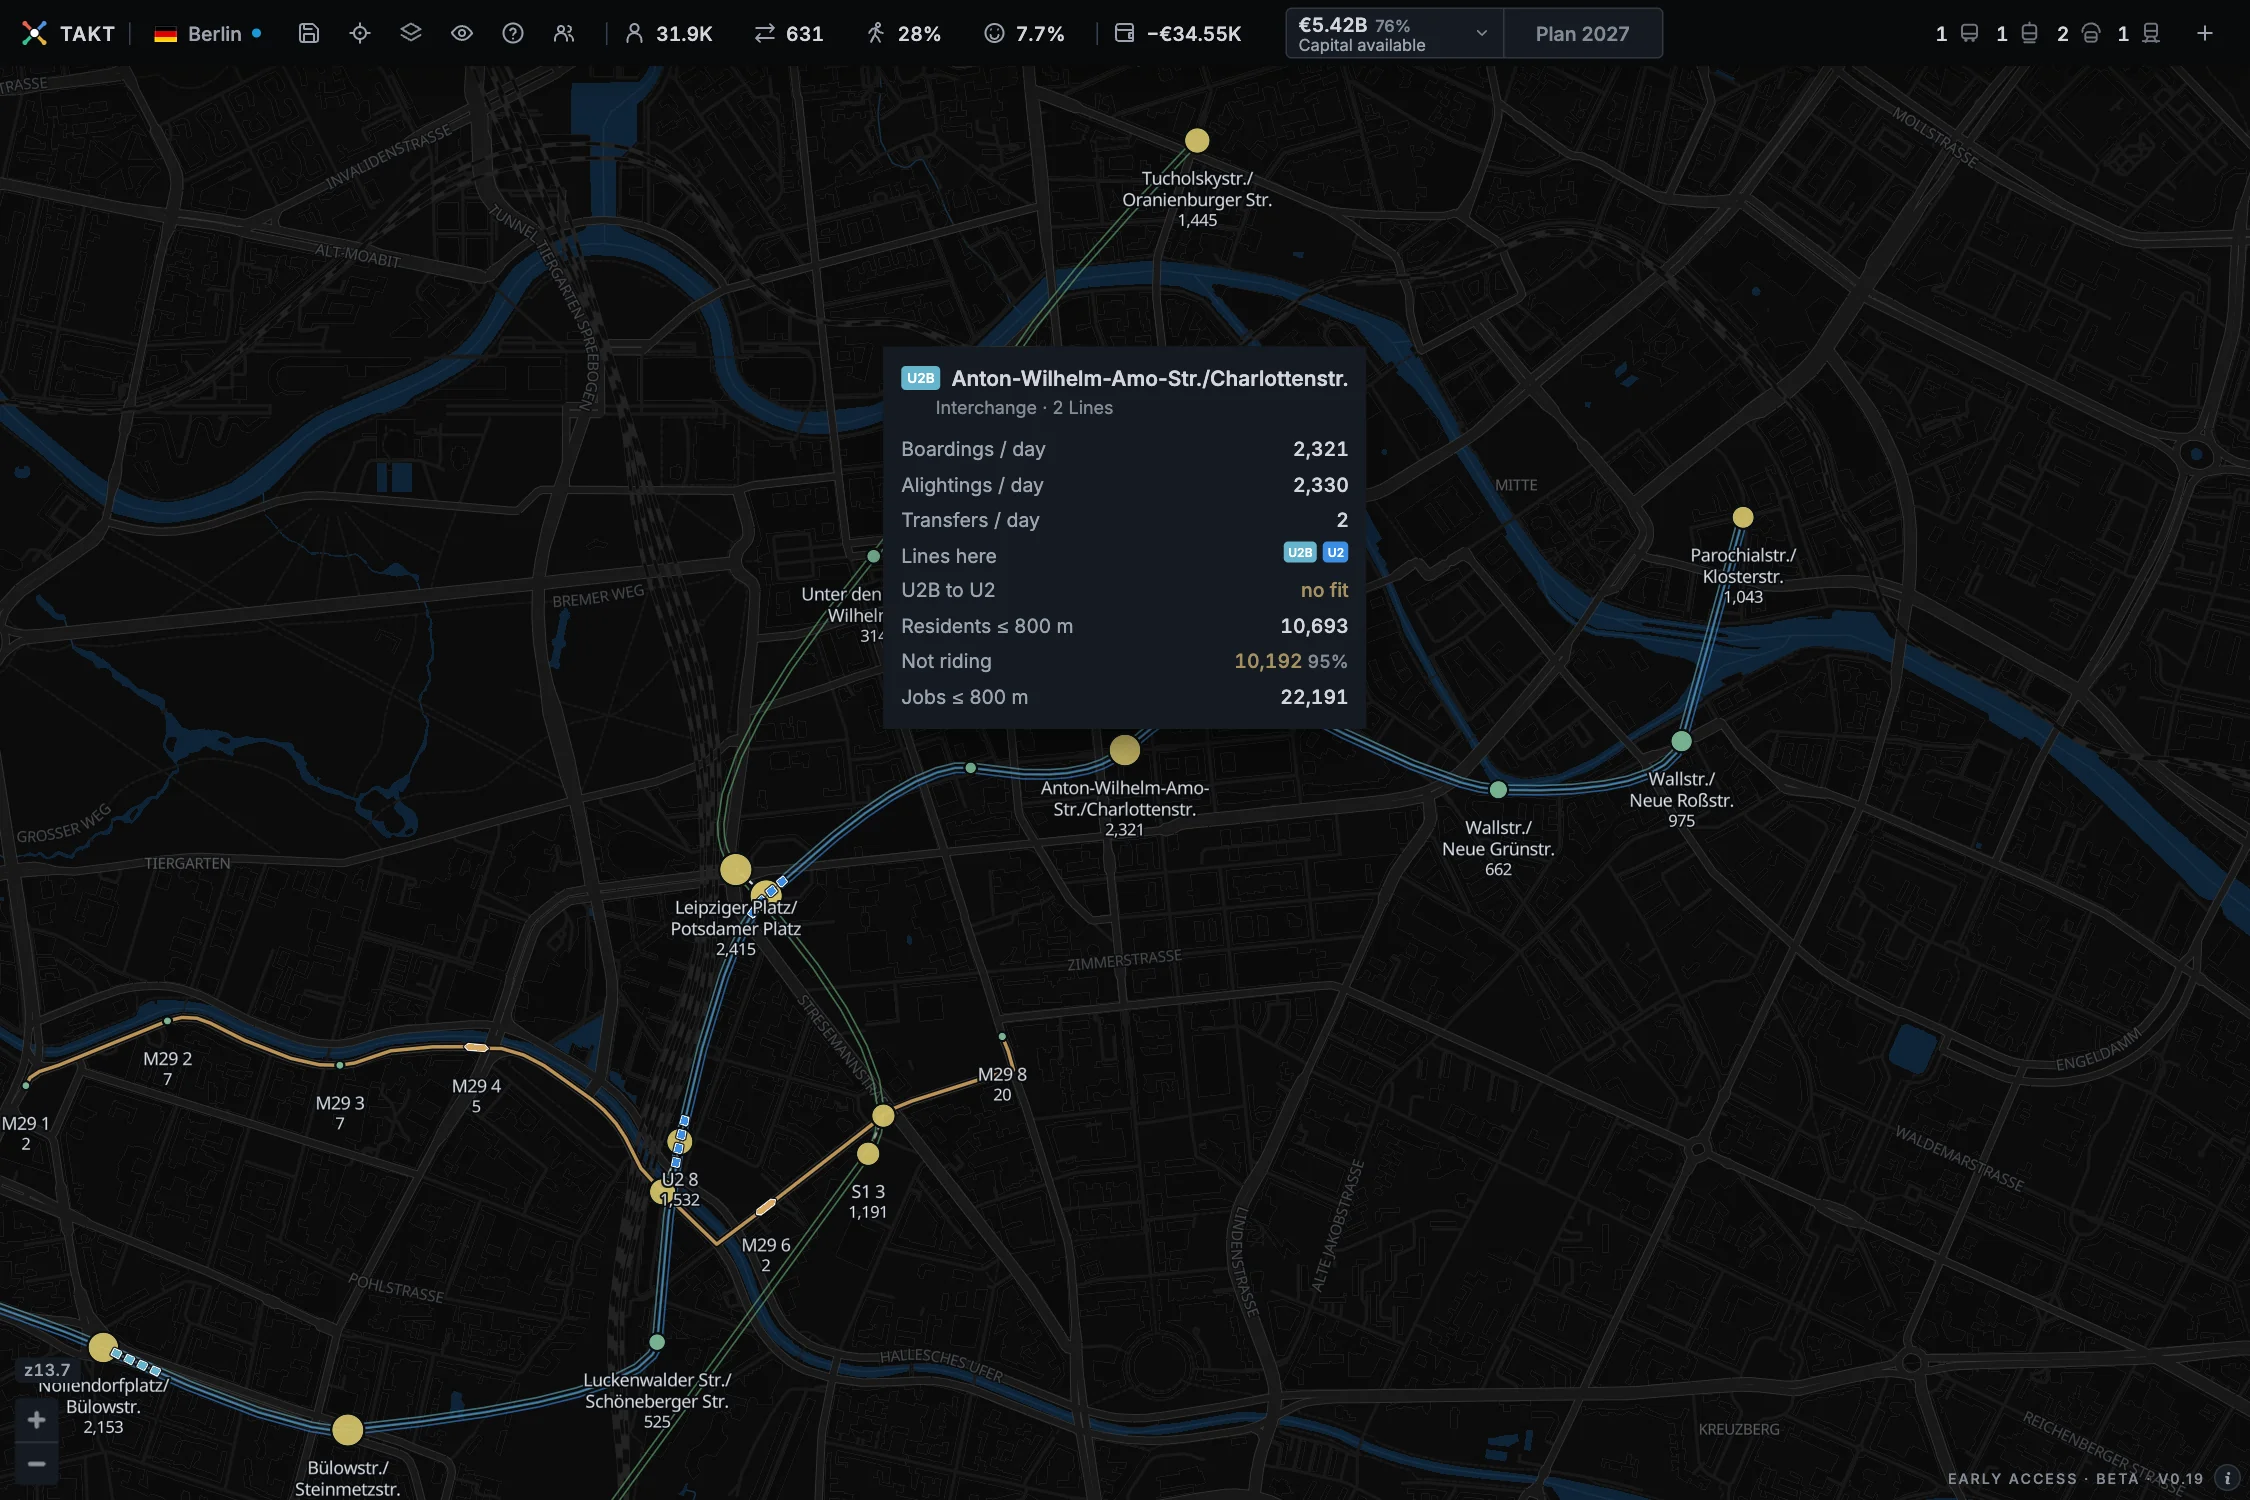
Station loads shows how many passengers board at each station per day. Larger circles mean more boardings. Green shows lower use; red shows higher use.
Read the station count to compare two stops. A busy station does not always mean that its services are crowded.
Find slow sections
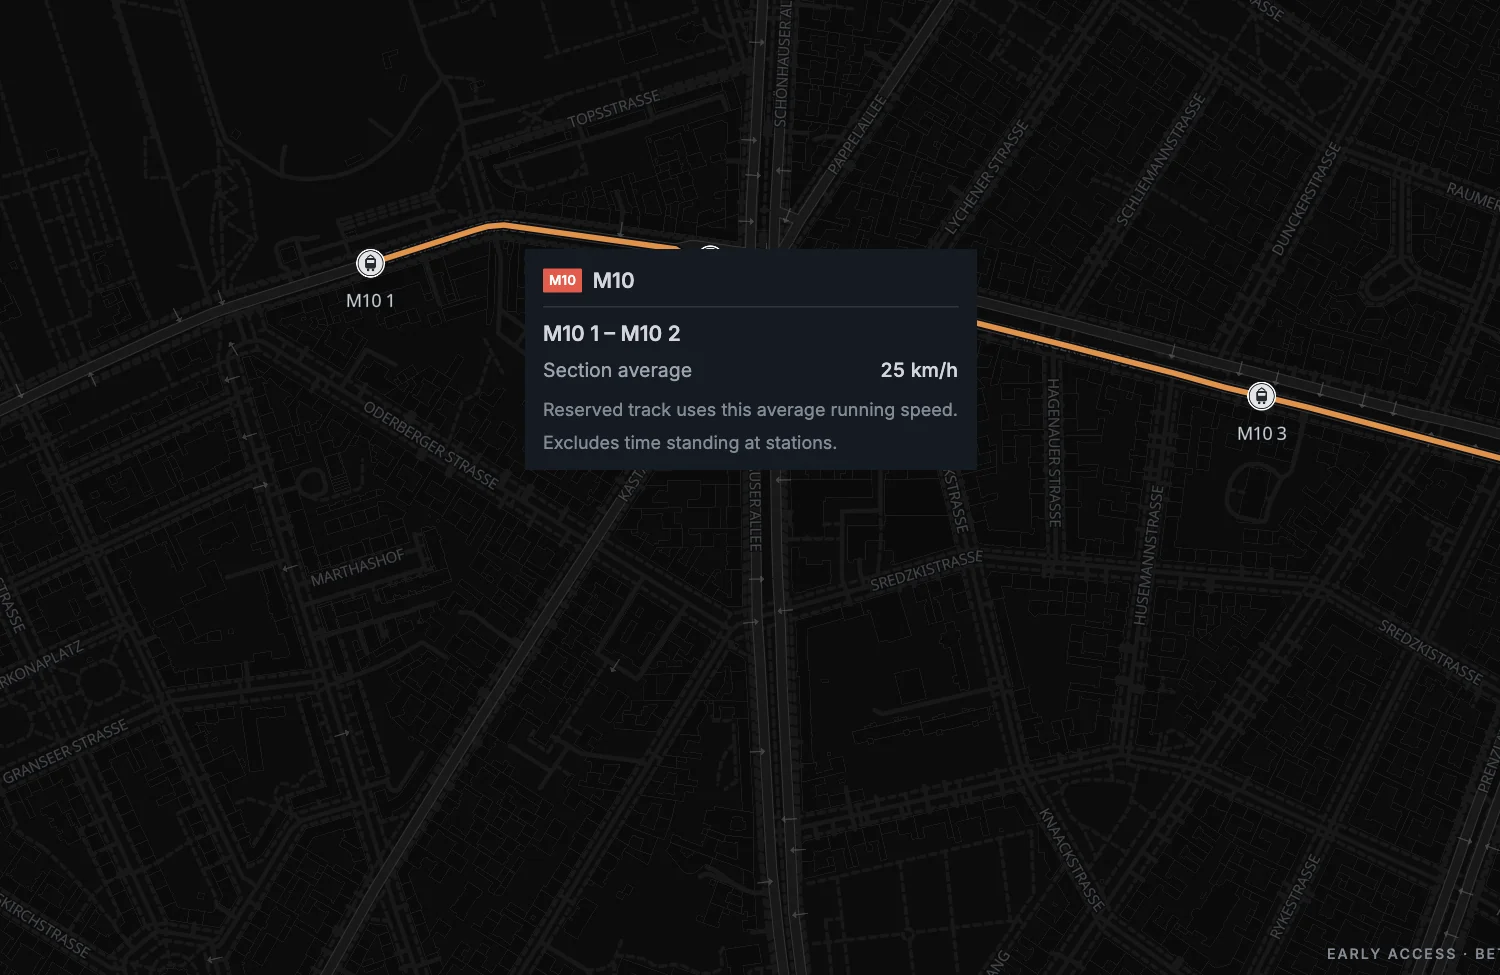
Select Speed to find slow sections. Colours change in steps of 10 km/h. Red means slower; green means faster.
Grey sections near metro and railway stations show normal speeding up and braking. Hover over the track to see its speed and explanation.
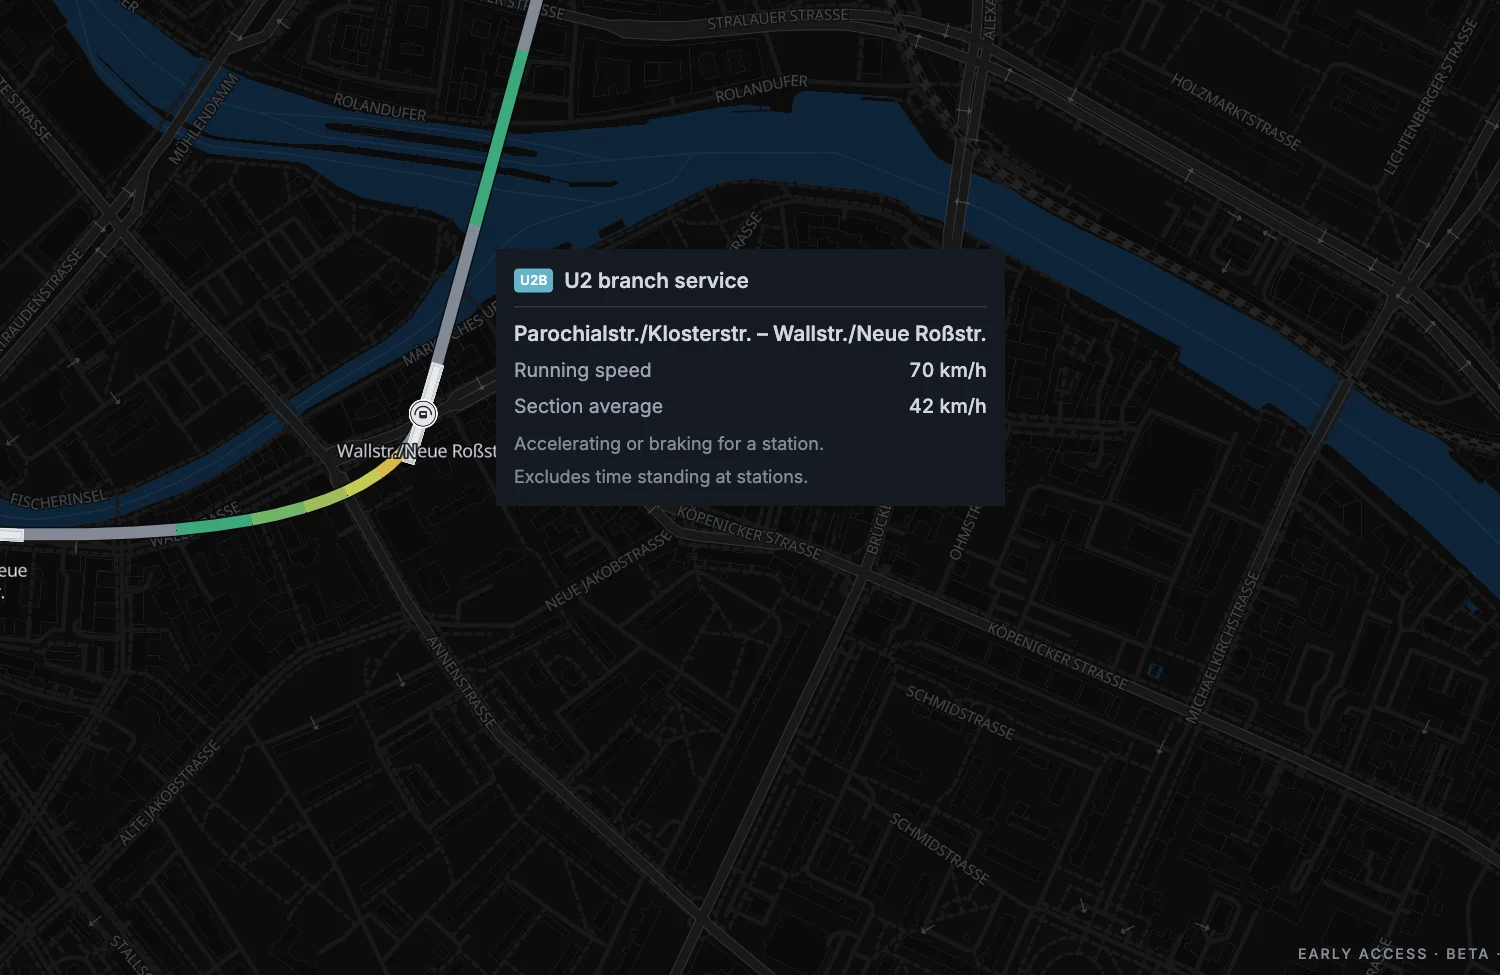
Bus and tram speeds are averages for the section.
See how often services run
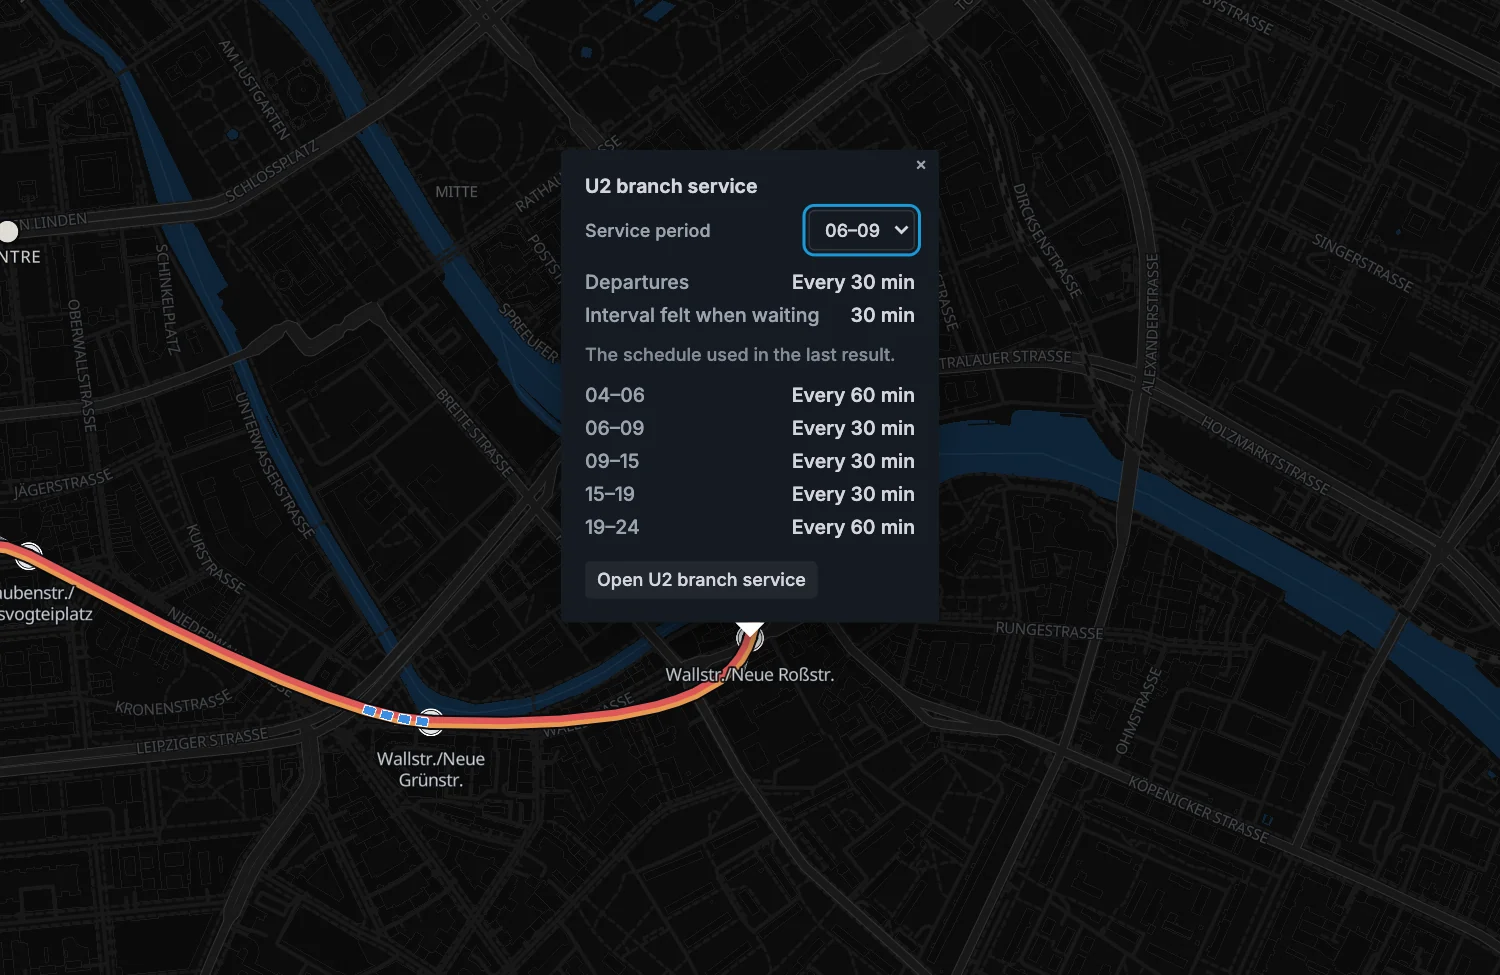
Frequency shows how many minutes pass between departures. Short waits are green, long waits are red, and no service is grey. It uses the timetable from the last completed year.
Click a section to open its card. Choose Service period to inspect another part of the day.
Check transfers between lines
Station transfers shows where passengers change lines. Larger circles mean more transfers. Red means long waits or unreliable connections.
Click a connection and choose a time of day. Check the walking time, expected wait and chance of catching the next service.
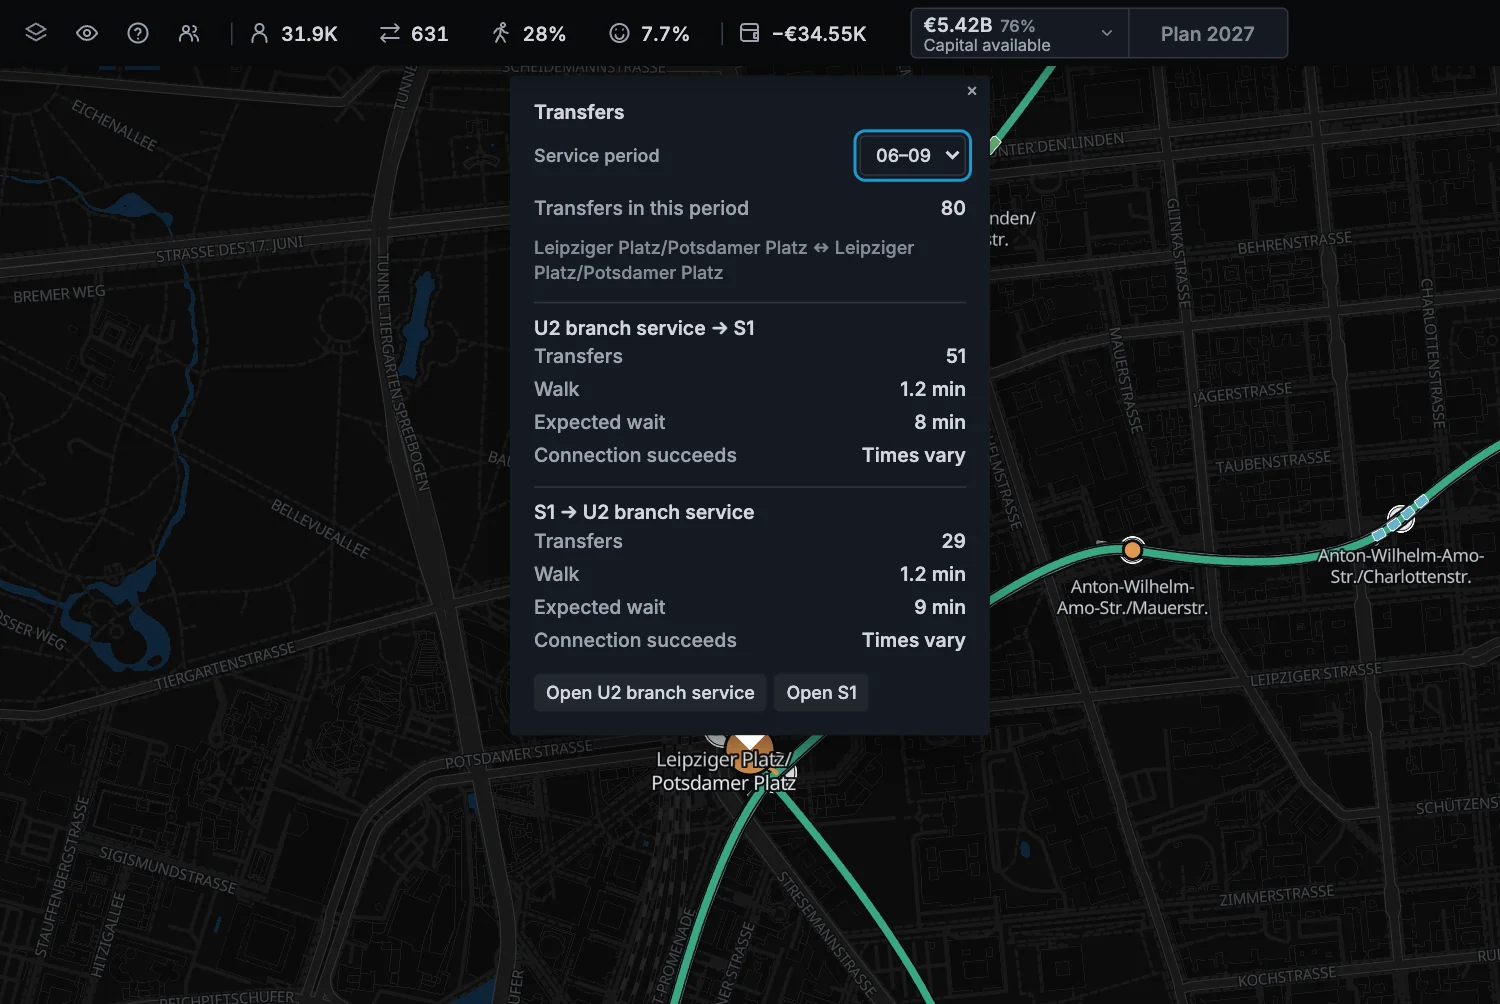
Some older saves only have daily transfer totals. Finish another year to get details for each time of day.
Check whether more trains fit
Track capacity shows whether a section has room for more trains. Click a section to see trains per hour, its limit and the lines using it.
This view updates when you change the planned timetable. It counts hidden services too. New track adds capacity when construction finishes.
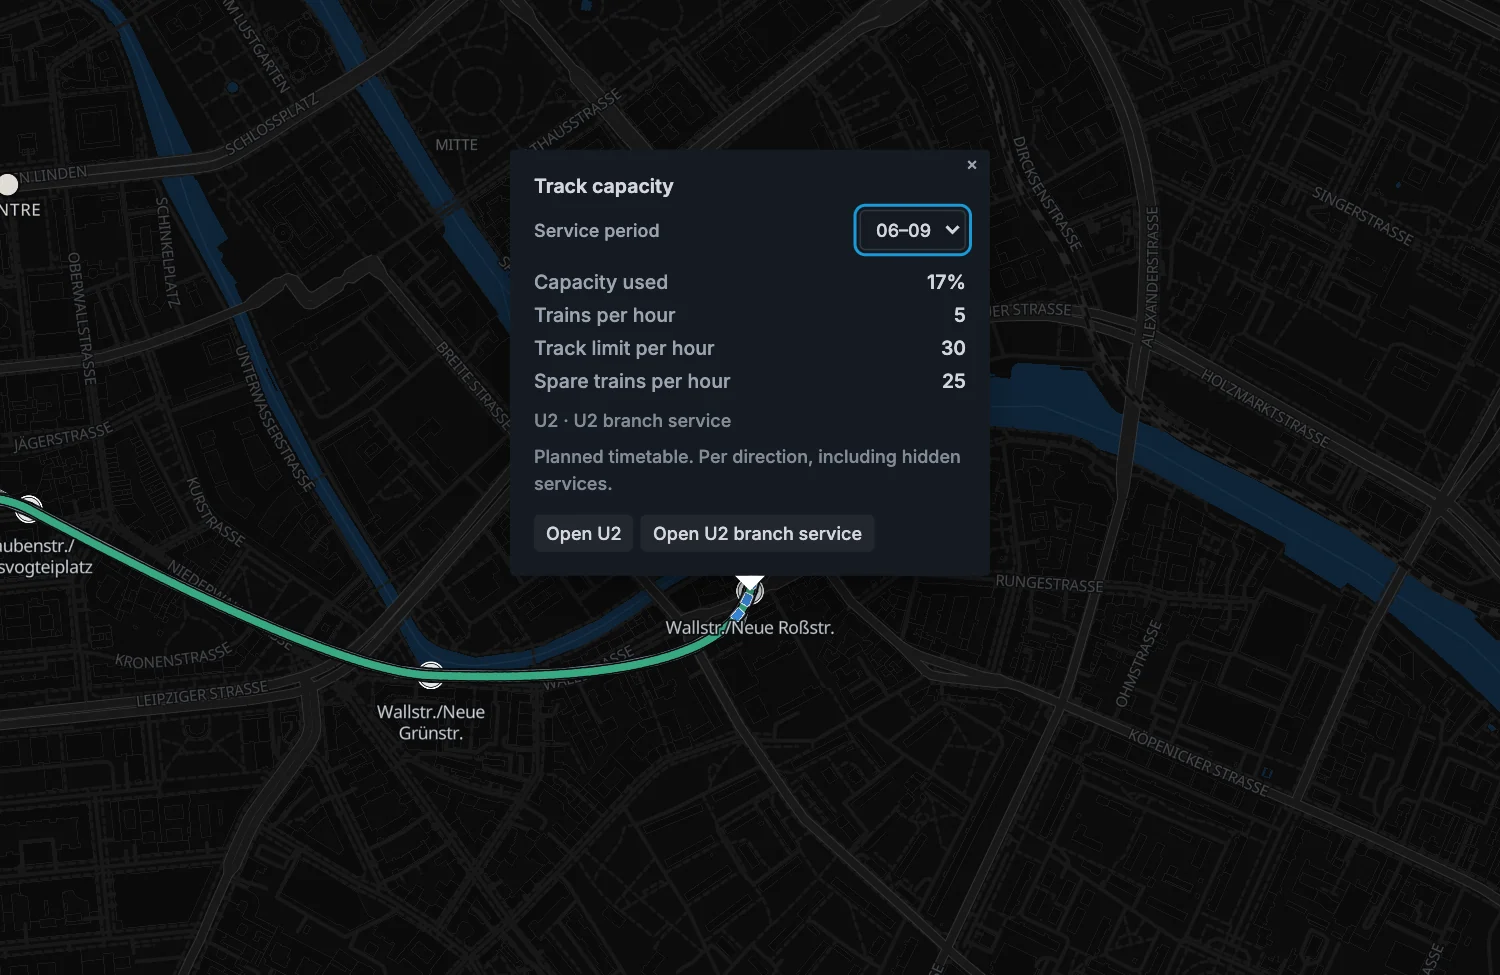
Green means below 65% of track capacity. Yellow starts at 65%, amber at 85%, and red at the limit.
Frequency, Station transfers and Track capacity use the same selected time of day.
Frequency and Station transfers show the last completed year. Track capacity shows your current plan. Timetable advice helps you choose the next action.
Show only the lines you need
Open the line list from the right end of the top bar. Use All lines if a line card is open.
Click the eye beside a line to change its visibility. From its normal state, the first click shows only that line. The eye turns green.
Click again to hide that line. The eye turns red and has a slash. Click a third time to return to normal visibility.
The route and vehicles disappear, along with stops used only by that line. Shared stops remain for the lines still visible.
The four icons beside Show control buses, trams, metros, and railways. These switches sit above the list, beside sorting.
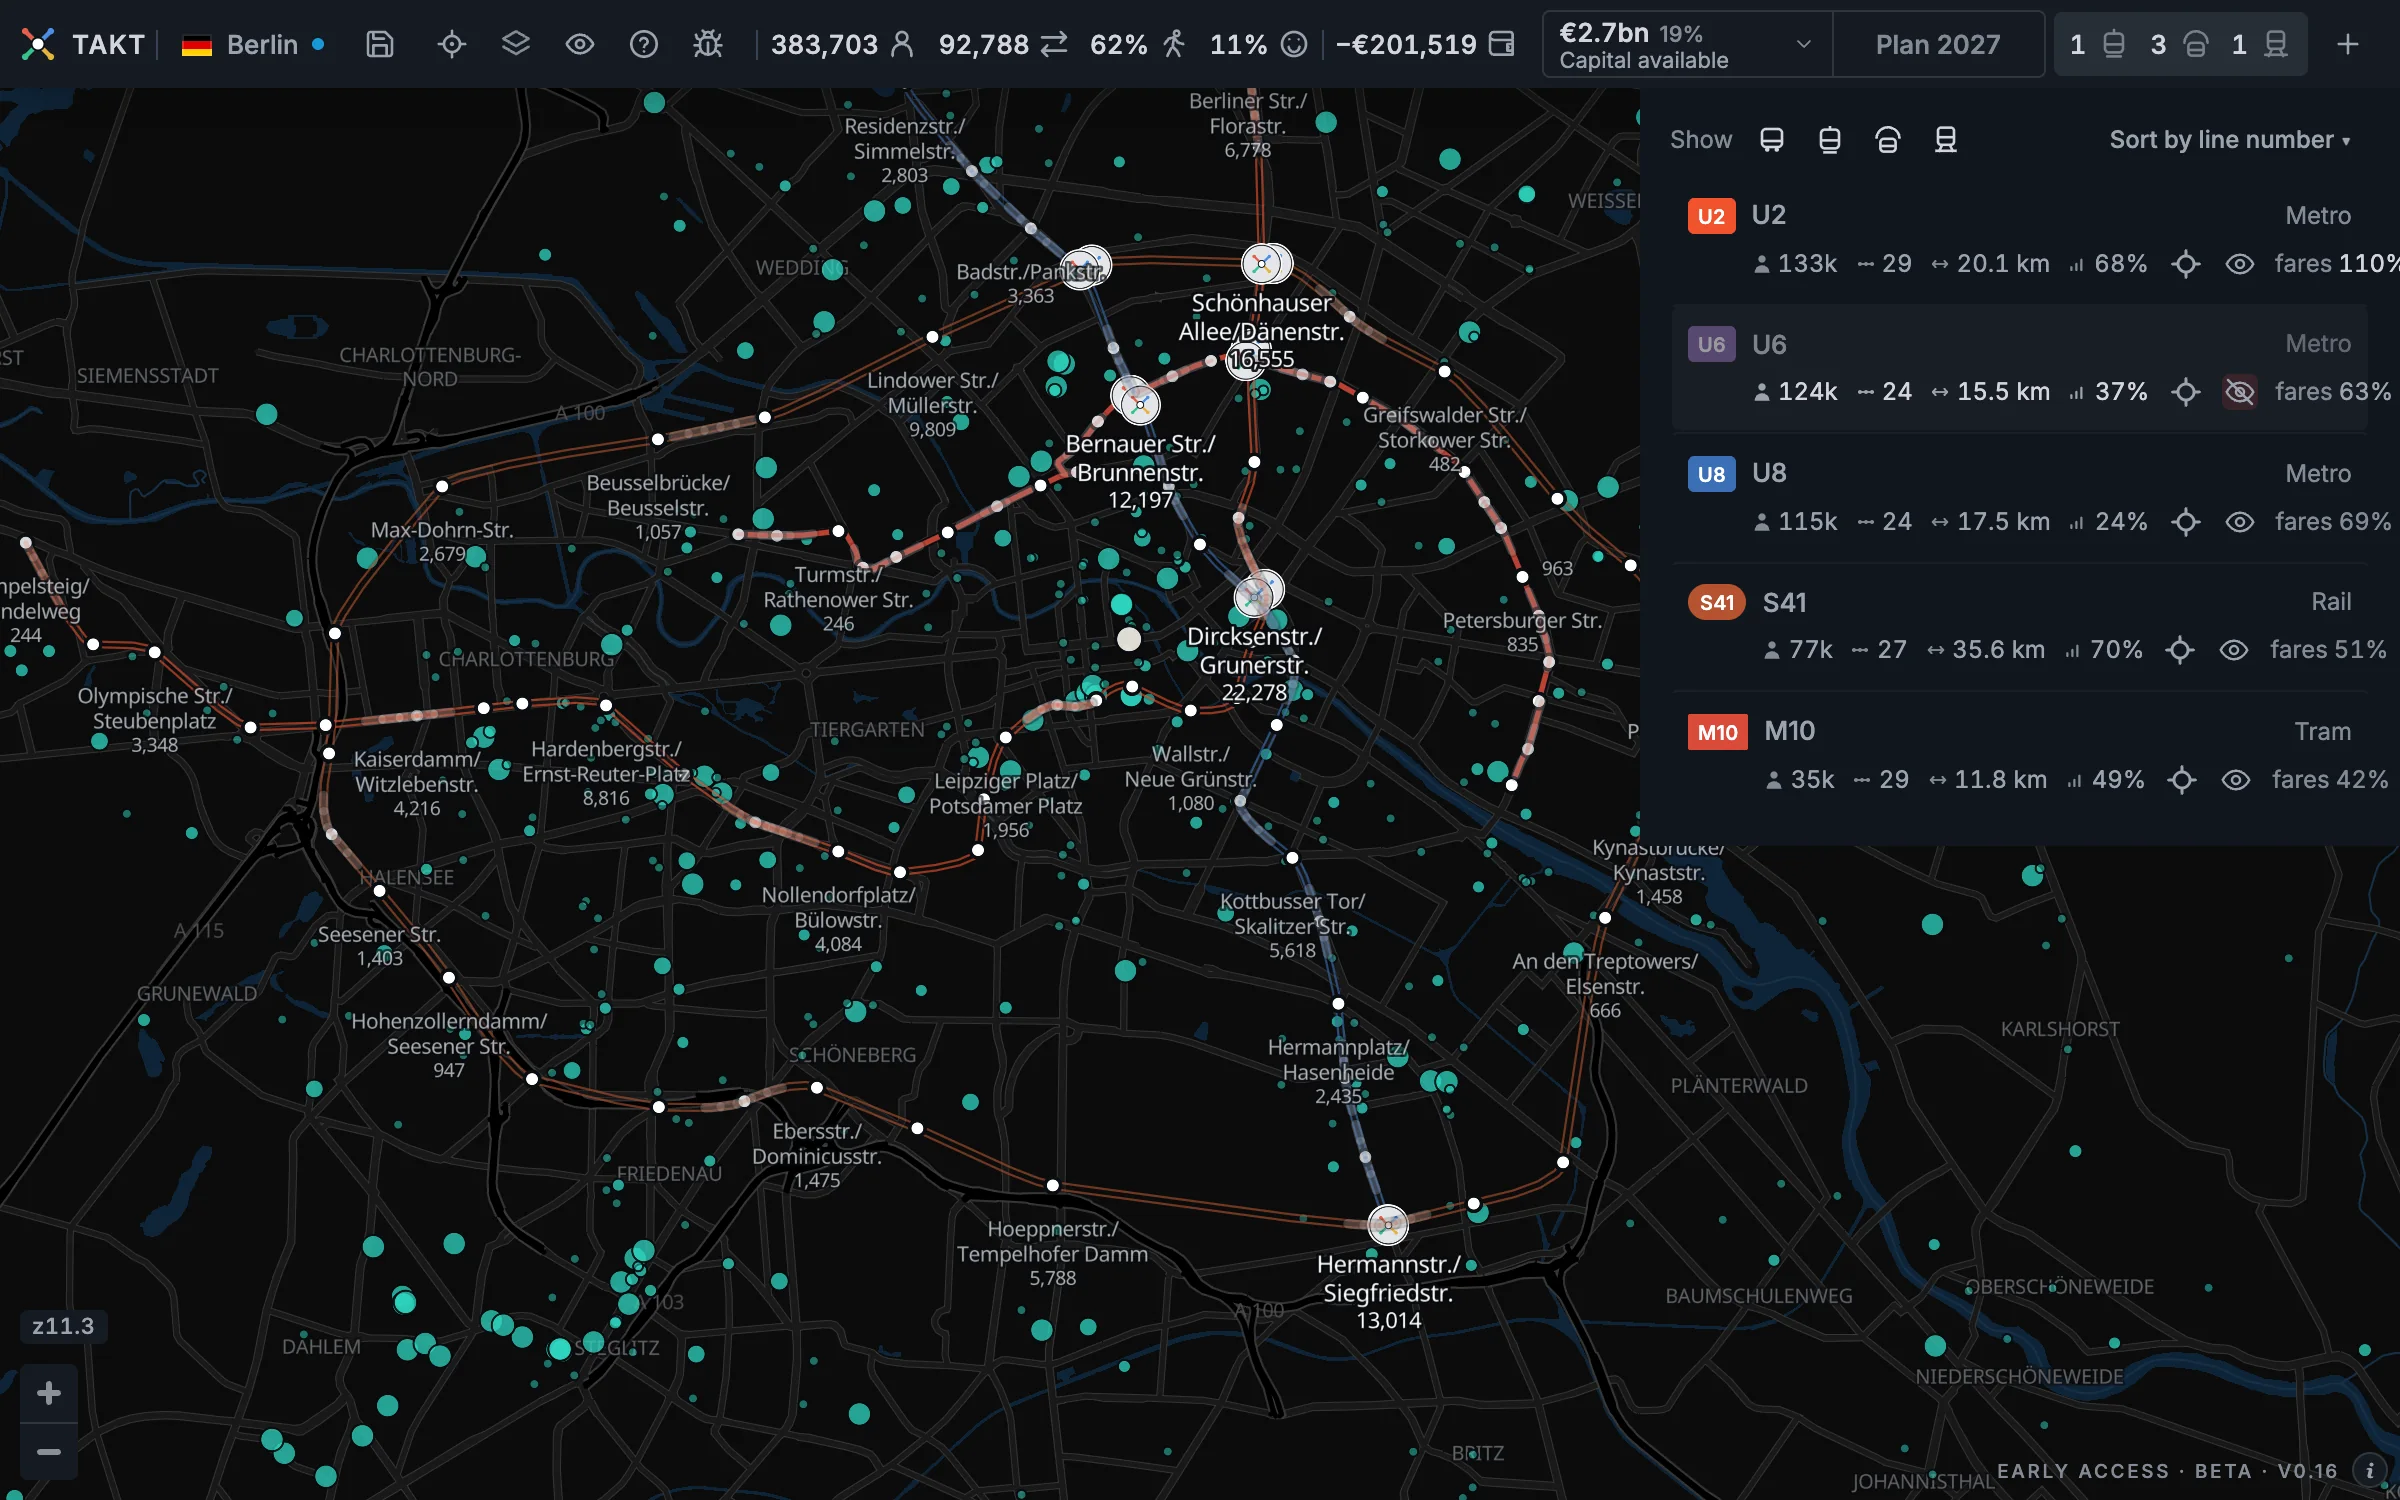
The transport-type buttons work the same way: show only that type, hide that type, then return to normal visibility.
Showing only another line or transport type replaces the previous selection. Your other visibility choices return when you stop using Show only.
Hidden lines stay in the list. If a line is missing from the map, check its eye and its transport-type button.
Click the crosshair to show a line and move the map to it. Clicking a station link also shows its line.
Hidden services keep running. Visibility does not change riders, costs, capital, or the year plan. Takt remembers hidden choices separately for each city.
Show only is temporary. Reloading restores your saved visibility choices.
Hiding a line stops station placement. Show the line and select a station before building from it again.
Where the playable area ends
You can only build inside the playable area. The map can show streets outside it, but you cannot place stops there.
The area outside is shaded. If you try to place a stop there, the build card says Outside the city.
A grey street can still be inside the playable area. It may have little demand or already have good transport.
City borders and district outlines do not mark the edge of the playable area.
Berlin includes surrounding towns such as Potsdam.
Change the map background
Click the eye in the top bar to change the map background. Choose a dark map, a bright map or satellite imagery where available.
Basemap brightness changes the background brightness. Demand brightness changes the brightness of demand colours. Neither changes your results. Use Sounds to turn game audio on or off.
Choose a city or read about it
Open the city name in the top bar to choose Amsterdam, Berlin, or Hong Kong. The i beside the active city opens its information card.
Below the three cities, Suggest or vote for a city opens the Reddit discussion.
Before building a new line: turn on Demand streets, Places and City requests. Find an area that needs better transport and connect it to places people want to reach.