Your first stop is the start of something bigger. Connect the city with
buses, trams, metro and regional rail, choose how often they run, and see how your
decisions change the way people travel.
Berlin's real network checked against published ridership9.9 million daily trips modelled in Berlin4 cities ready to playNo install. No account.
Real city. Real demand. Real money. The city already has people
going to work, school, shops and everywhere else. Most of them can already drive. Your
network has to give them a better option.
FIG 0.1
Plan now. Calculate once.
Planning uses a fast preview, so drawing and editing stay instant. Finish
the year when you are ready. Takt then runs the full weekday: who rides, who transfers,
who cannot get on, and who keeps driving.
FIG 0.2
Built from the real city
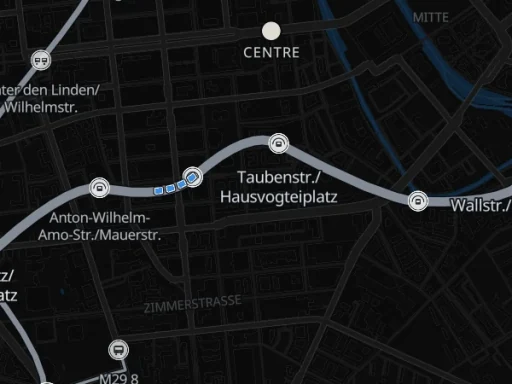
Streets, homes, jobs and places come from real map and census data. Put a
station somewhere and it reaches the people who actually live and work nearby. Put it in
the wrong place and it does not.
FIG 0.3
Set the takt
The takt is simply how often a line runs. Set it separately for five parts
of the day, and Takt works out the vehicles, waits and connections. More service attracts
riders, but costs more to run.
The ground · fourteen looks
Midnightours
Fiordopenfreemap
Positronopenfreemap
City aerialwarsaw, official
Libertyopenfreemap
Liberty 3Dtilted
Choose your map. Dark, light,
satellite or local aerial imagery. Change the look whenever you want. Your demand, traffic
and network stay exactly the same.
The city reacts to what you build
Finish a year and Takt works out who uses your network, who transfers,
and who chooses another way to travel. Each city has its own homes, workplaces and
destinations to connect.
1.0 The model
1.1 · SATISFACTION
Every trip you miss has a reason
Some people cannot reach a stop. Some wait too long. Some face a bad transfer, a full
train or a fare they do not want to pay. Takt shows you why they stayed away, so you know
where the network is failing.
1.2 · THE TAKT
Set the takt
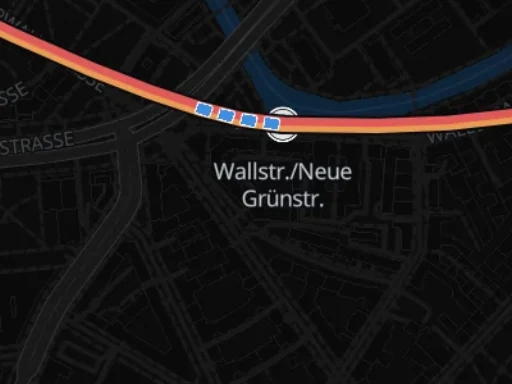
The takt is simply how often the line runs. Drag the columns for five parts of the
day; their colours show when vehicles are quiet, busy or full.
Save a timetable with a name and reuse it
on other lines, across games and cities in the same browser.
1.3 · BUILDING
Priced before you click
Before you place anything, Takt shows what the next click builds and costs. Compare
surface, elevated and tunnel options. Share another line’s track, or
build parallel metro or railway track for separate
capacity, choosing which stations your line serves.
1.4 · THE YEAR PLAN
Plan first. Finish the year when ready.
Planned removals appear on the map at once. Remove a terminus, then extend the new
end in another direction. Capital stays reserved until you finish the year to build
the plan and calculate its exact result.
1.5 · CITY REQUESTS
The city asks, and pays
Places that still need transit show up as challenges on the map. Reach enough of
their people and the city helps pay for your next project. Ignore them, or stop serving
them, and that money goes away.
1.6 · PLACES
Real places make real trips
People do more than commute. They go to school, shop, visit clinics, go out at night
and catch flights. Those places create trips at different times of day, so where you
build and when you run the service both matter.
1.7 · THE STATIONS
Every stop, counted
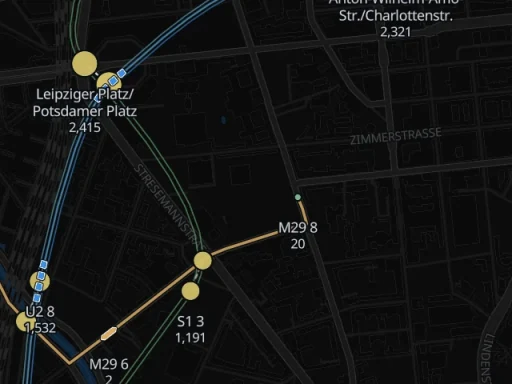
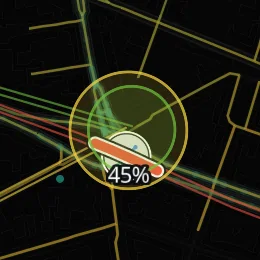
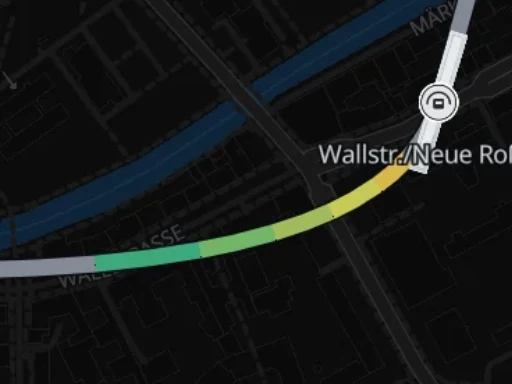
See daily boardings, vehicle crowding and the time vehicles spend at each station.
Sort the station table to find the busiest stops. Clear controls keep naming, service
and track choices together. The exact figures update when you finish the year.
1.8 · THE MONEY
Fares are a tradeoff
Raise the fare and each trip earns more. Raise it too far and people stop riding. The
daily result shows what passengers pay, what the service costs, and what the city has
to make up.
1.9 · THE MODES
Four modes, four different jobs
Buses are cheap and flexible. Trams carry more but need better streets or their own
track. Metros move huge numbers through dense areas. Regional rail is built for long
distances and widely spaced stations. Pick the mode that fits the problem, because the
expensive answer is not always the best one.
Mode
Riders
Speed
Build cost
Walk reach
Bus
90
18–23 km/h
€0.4–2.5M / km
500 m
Tram
250
19–33 km/h
€9–85M / km
600 m
Metro
750
70 km/h
€32–120M / km
800 m
Rail
1,000
58–78 km/h
€22–95M / km
1,500 m
Where you build matters too. Street-running lines are
cheaper. Dedicated, elevated and underground routes cost more, but they can be faster
and avoid traffic. Building through dense areas or across water can get expensive
very quickly.
The answers are on the map
Find busy stops, slow sections and weak connections. Choose a layer in the
Stations, Lines or City group to plan your next change.
1.9 The map
We compare modelled ridership with published figures for real networks.
This Berlin comparison records the result for the model and city data from 26 August 2026.
1.10 The check
Real network
Takt predicts
Published ridership
Ratio
U-Bahn + S-Bahn, rail-only run
2,920,623
~2,900,000
101%
All Berlin, 345 lines
4,588,528
~4,300,000
107%
These are daily boardings. A journey with a transfer can board
more than one line. The full network includes buses and trains competing for the same
trips. The rail-only run includes U-Bahn and S-Bahn services without buses.
Pick a city. Build it from scratch.
Berlin, Amsterdam, Hong Kong and New York are ready to play, free during beta.
Every city starts empty, but each one gives you a different problem to solve.
2.0 Cities
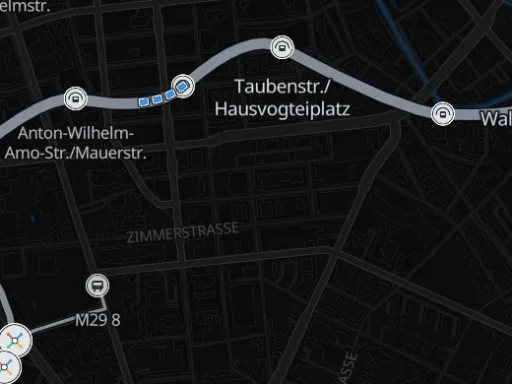
Berlin is used to having transit everywhere. This time, it starts with nothing. Rebuild
the city from the first bus stop up, find the corridors that deserve the big investments,
and see whether your Berlin works better than the real one.
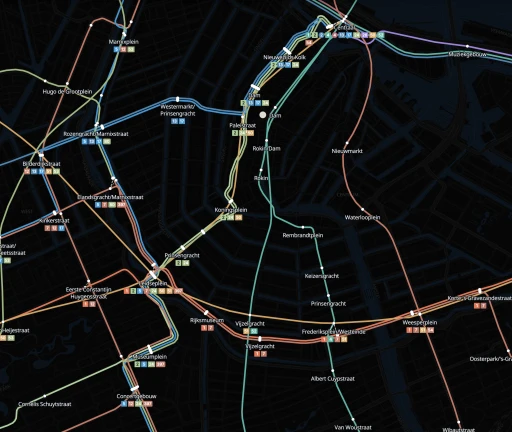
Plan around the canals and build trams along mapped corridors such as Leidsestraat
and Utrechtsestraat. City requests follow official districts. Connect surrounding towns
to unlock their local requests. Includes detailed Dutch aerial imagery.
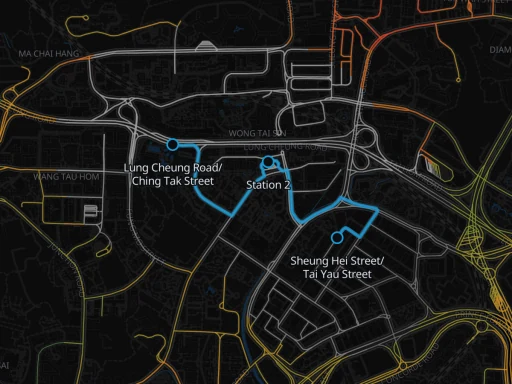
Hong Kong fits homes and jobs between steep hills and water. The harbour divides its
busiest districts, while the new towns reach far north. Build the crossings and feeder
lines that make one network from all of them.
Manhattan draws commuters from across the boroughs and the New Jersey shore.
Connect neighbourhoods, choose your river crossings, and build a network that reaches
beyond the island.
Coming next
WarsawSoonAcross the Vistula
Warsaw is split by the Vistula. People and jobs sit on both sides, so sooner or later
your network has to cross it. Start cheap, find the routes that work, then decide where
the big crossing is worth the money.
IstanbulSoonAcross the Bosphorus
Istanbul is huge, and the Bosphorus splits it in two. You start with enough money to
think big, but every crossing is expensive. Build the right links between the two sides
without spending the whole budget on one idea.
Los AngelesSoonLong distances · Fast roads
In Los Angeles, the car is winning before you build anything. Distances are long and
the freeways are fast. Find the corridors where transit can actually compete, because an
expensive line is useless if nobody chooses it.
Want your city next?
Upvote a city's comment or suggest a missing city in our Reddit post.
an early build – rough edges expected · how to play
Frequently asked questions
Quick answers about the game as it works today.
What is Takt?
Takt is a transit planning game played on real cities. Start with nothing, build bus,
tram, metro and regional rail lines, and decide how often they run. Then see who uses
your network, who keeps driving, and whether you can afford it.
How do I play?
Pick a city, press + to start a line, and plan directly on the map. Add
the work to the current year, then finish the year when you are ready. Takt builds the
plan and calculates its exact result. The guide explains buses,
trams, metro, rail and the rest with pictures.
Can I build without a budget limit?
Yes. Turn on Sandbox mode in the
Dashboard, under Capital & funding. You can keep building when the construction budget
runs out. Costs still count, and construction times and the passenger simulation still
apply. You can switch it on or off in an existing game.
How do I save my game?
Open Saved games, enter a name and choose Save new. Each saved game has separate
Save and Load buttons. Loading asks for confirmation and keeps your current game under
Recovery copies. Saving over a game also keeps its previous version there. Download a
.takt file to keep a copy outside the browser.
Is Takt free?
Yes. Berlin, Amsterdam, Hong Kong and New York are free to play during beta.
Berlin and Amsterdam will stay free. Later cities will be available individually or in packs. All cities
play by the same rules. You only pay for more places to play.
Is it really a simulation of my city?
It uses the real city as its starting point. Streets, homes, jobs and places come from
map and census data. Takt compares your service with driving, walking and cycling.
Trips and travel choices are estimates. The Berlin comparison above shows a check
against published ridership.
When can I play it?
Right now. Berlin, Amsterdam, Hong Kong and New York are open in your browser, free during beta and without an account.
Takt is still in beta, so expect a few rough edges while I keep building it.
Which cities will there be?
As many as I can make. Berlin, Amsterdam, Hong Kong and New York are open now. Warsaw,
Istanbul and Los Angeles are coming next, with more cities after that. Tell me which city you want and
I’ll use the requests to help choose what comes next.
Who is making this?
I’m David Karpik, an independent developer in Germany. I build Takt, the model behind
it and the cities you play on. I also built Clickport,
an analytics product, dark and dense like Takt, and countless other web projects since 2005.
Changes
What changed in the game, by date. A player gets each change on the
next page load.
2 Oct 2026v0.25
A new dashboard. See all your lines in one table, with each change since last year.
Smoother building. Improved station and cursor handling.
Better city maps. Fixes for Hong Kong Light Rail, Berlin buses and Amsterdam road works.
28 Sept 2026v0.24
See who your stations reach. The new Station reach layer highlights streets within your operating and planned stops’ walking radius. While placing a stop, see the extra residents and jobs it reaches. Reach uses straight-line distance.
Smoother trains and buses. Vehicles move more smoothly on busy networks. Demand streets and traffic use less memory while keeping the same map detail.
Give your stations local names. Choose names from nearby places, or rename a whole line’s stations with a preview. Your custom names stay unless you choose to replace them.
Undo and redo beyond building. Press U to undo and R to redo, even after leaving building mode. Undo now keeps your last ten steps to reduce memory use.
More flexible shared tracks. Branch between stations without adding a stop. New stations on shared track serve the lines using it, and connected track plans join the year plan together.
More ways to connect towns. Journeys with up to two transfers now count towards town connection targets and grants, provided they meet the journey-time target.
25 Sept 2026v0.23
New York is here. Connect Manhattan, the boroughs, and the surrounding towns. Plan your river crossings and build a network that brings the region together.
Smoother maps. Zooming is faster across all cities, with the biggest improvement in New York.
Make your network your own. Name your transport company, choose from 30 logos, and pick an accent colour. Your company name and logo also appear on shared network images.
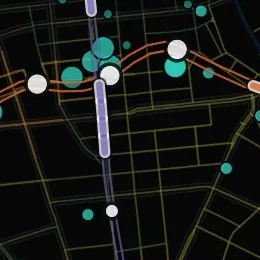
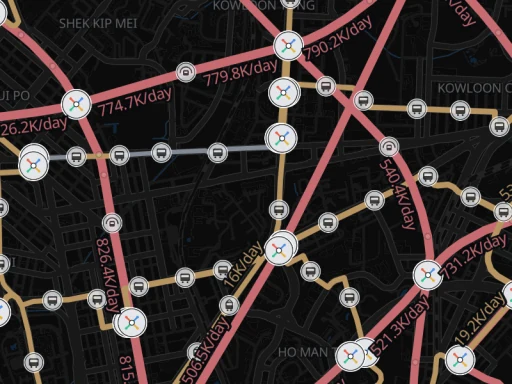
See your busiest routes. The new Passenger flow layer shows daily passenger numbers along each section, with wider lines for busier routes. Shared sections combine passengers from all services. New line statistics show total passenger distance and average daily traffic along the line.
Reshape your network with the bulldozer. Remove stations, stops, and route sections across all transport modes, or open a ring line by removing one section. Hover to preview each removal. Cancelling unbuilt sections is free; built removals take effect when you finish the year.
Run metros every two minutes. Give busy lines more frequent service wherever track and station capacity allow.
Extend shared platforms once. Services using the same platform now share its length and extension costs. Pay for one extension, and every service calling there benefits when it opens.
Better protection for your saves. Failed saves can retry, and older tabs are prevented from overwriting newer progress. Clearer warnings explain when saving is blocked and what you can do next.
More consistent construction costs. Paid track costs stay recorded when services are parked or removed, and loading fixes prevent inflated construction bills. The budget display explains how much money remains available and how much is reserved.
Smoother route editing. Bus and street tram gaps reconnect along roads, while off-street tram stations and waypoints stay where you placed them. Press U to undo and R to redo while building.
Reconnect after demolition. Demolished stations no longer force you to rebuild through their old positions when the track on both sides is gone.
Smaller fixes throughout. Shared games retain Sandbox mode, live traffic returns correctly after map-style changes, and station figures and line tooltips receive corrections. Hong Kong’s airport area also has a clearer name to distinguish it from Tung Chung Town Centre.
21 Sept 2026v0.22
Build beyond your construction budget with Sandbox mode.
Switch it on or off inside an existing game. Costs, construction times and the simulation still apply.
Save a timetable with a name and reuse it on other lines,
across games and cities in the same browser. Each line keeps its own copy.
Shared and parallel track follow the stations you choose. Skip intermediate stops or click away
to continue on your own track. Curved approaches, level changes and rebuilding gaps beside shared
track work more consistently.
Game-file downloads and shared networks are compressed, and shares support larger networks.
A saved game that fails to open is protected from being overwritten by autosaving.
The city menu puts the three playable cities first, followed by the suggest-and-vote link.
The info button beside your active city opens its information.
19 Sept 2026v0.21
Building metro and rail track got much easier and more intuitive. Draw your line to a station
of another line and keep clicking its next stations: your line runs on the same track, at no cost.
Want your own track? Click anywhere else. Lines can meet at any angle, and a second track beside
another line takes one click for each station. When you delete a line, choose to keep its track
or to remove it; track that another line uses always stays.
Stations look like real stations. Platforms follow the curve of the track. A big station with
several tracks gets one hall with a glass roof, and trains drive in and out under it.
Saving big networks no longer makes problems, and Network view is much faster on big networks.
17 Sept 2026v0.20
Read your network as a transit map in Network view.
Separate service colours, clear station markers and line badges make shared routes and interchanges easier to follow.
Click a line badge on the map to open its line card. Click it again to show only that service.
Share larger networks with saved games up to 20 MB, increased from 5 MB.
Build parallel replacements with separate platforms at both ends, including beside shared track.
Remove obsolete isolated stations after their adjacent track is gone.
Build along corrected Hong Kong Light Rail corridors in Tin Shui Wai and Tuen Mun with the tram tool.
15 Sept 2026v0.19
Build parallel metro and railway tracks to add capacity beside a busy route.
Remove and rebuild individual track sections while keeping the stations and timetables.
Edit timetables more smoothly in large networks. Advice explains crowded services
and helps you choose more departures, longer platforms, parallel tracks or another route.
Severe overcrowding reduces satisfaction more strongly when you finish a new year.
The Year report identifies affected lines, hours and busy sections; earlier scores stay unchanged.
Read running speeds, station boardings, transfers, frequency and shared-track capacity
on the map. Grouped layer controls make these views easier to find.
Amsterdam gains missing tram connections and bus roads. Hong Kong airport trips
now connect to nearby terminal stops and Airport Station.
11 Sept 2026v0.18
Hong Kong is open. Build bus, tram, metro and rail lines across Hong Kong Island,
Kowloon and the New Territories.
Review construction and timetable changes before finishing the year.
Confirm the plan or return to the map to keep planning.
Reopen saved Year reports to review passenger numbers, crowding and funding.
Test timetable suggestions before adding them to your plan.
See each district's daily journeys and share of trips carried, with changes from
the previous year. Search all districts and towns.
Join shared metro and rail tracks with curved connections and a preview of
construction costs. Closing a ring keeps the track you already built.
7 Sept 2026v0.17
Click the capital amount to open the new Dashboard. Overview compares completed
years with headline trends, network growth, income and operating-cost charts.
Search and sort lines by riders, crowding, income, cost and result. Open a line
for its busiest stations, section loads and available yearly history.
Finances keeps the selected year's accounts together. Projects shows the current
construction plan beside the work recorded in an earlier year.
Capital & funding shows five Jobs, five Homes and five Towns matching the map,
with pictures and progress. Click any part of a card to show its place.
See further targets, search all funding conditions and read payment history.
Eligible districts can earn grants at year end without a previous offer.
Permanent funding continues at 6%, 8%, 12%, 16% and 20% ridership.
Regional awards reward 5, 10 and 15 connected towns after the 4% ridership award.
Berlin's playable streets and demand now extend across its mapped surrounding
towns, including Potsdam. Official district and town boundaries support grant details.
Duivendrecht and Ouderkerk aan de Amstel have separate boundaries and grants,
as do Muiden and Muiderberg. Existing games keep their network and recorded years.
Line loads shows the busiest load on each section. Click a section to open its
line's Full station view, with the highest loads first.
Choose the existing railway to reuse at an interchange and see its exact route.
Leaving shared rails requires an explicit choice to build new track.
Add a station to built metro or rail without moving its existing alignment
or charging for that track again. Undo keeps changes in planning.
Saved games restore district walk coverage, shared networks load more reliably,
and large-network line cards open faster. Operating results stay separate from construction money.
5 Sept 2026v0.16
The compact menu bar gives each network figure its own icon and details.
Capital and the yearly plan sit together, with clearer fonts and quieter panels.
Save and load games with separate buttons. Recovery copies keep your previous
game when you load another game or save over an existing one.
Station removals appear on the map while you plan. Remove a terminus, then
extend the new end before finishing the year.
Hide individual lines or whole transport types on the map. Hidden services
keep running and stay in the line list.
Amsterdam has official district boundaries, updated home and job locations,
and access to existing tram corridors. Demand streets show workplace demand more
clearly in Berlin and Amsterdam.
Existing v0.15 Amsterdam games keep their network and progress. Saved year
figures remain visible until Finish year calculates results on the updated map.
4 Sept 2026v0.15
Plan lines, stations and track changes without waiting for the whole city to
recalculate. Finish the year to build the plan and calculate its exact result.
Capital now keeps yearly results for riders, changes, walk reach, satisfaction,
money, districts and towns.
Saves from before v0.15 stay unchanged and cannot open in yearly planning.
Start a new city to use v0.15.
New v0.15 share links keep the current year, capital, projects and yearly history
when you open them on another device.
3 Sept 2026v0.14
Large cities load faster and use less memory.
Large networks stay responsive while you build, open line cards and move around
the map.
3 Sept 2026v0.13
Waypoints now shape only the new section. Track already planned or built stays
where you placed it, and waypoint mode no longer pulls towards other lines.
The demolition preview now marks the buildings under the planned curve. Its
building count and price use that same curve.
Built connections can earn city grants while another line remains as a blueprint.
Free fares no longer unlock permanent capital votes.
2 Sept 2026v0.12
Large networks recalculate much faster after a line or station changes. Smaller
networks keep the direct calculation that is faster for their size.
A saved game can now leave the browser. Download a portable .takt file from Saves,
then open that file on this computer or another computer.
31 Aug 2026
Lines carry a code on a badge, the way the city signs its own: in Berlin U1 on a
square, S1 on a pill, M1 and bus 100 on a rectangle. Click the badge to set the code,
its shape and its colour, or reset it to the city's sign.
The line list can be sorted. The button above it lists the lines by number, by
riders or by type, with the metro lines first. Each line keeps its number.
Stations can be renamed. Click the pen beside a station in the line's station list
and type a name, or take the name of a well-known place nearby, such as a square, a
stadium or a hospital.
A line opens on its own: while its card is open the other lines step aside, and
"All lines" above it brings the list back in its order. The open line's name stays
at the top while you scroll through its card.
Saves live in the browser's own database now. A big city no longer fills the
storage and stops saving.
30 Aug 2026
The city only asks for districts and towns that a bus stop can reach.
29 Aug 2026
Metro and railway lines can now run on another line's track and branch off it. Choose
R in the line card, click two stations of the other line, and the section between them
costs nothing to build.
Commuter towns now measure their trip to a visible Centre point. Click the marker to
see how many towns are connected, or open a town to see the route and travel time it is
judged on.
28 Aug 2026
Amsterdam is open. Click the city's name in the bar to switch.
A city greets you while it loads: its coat of arms, what it is and what the game
asks, over the loading bar. The first time it waits for Start; "About" in the city
list brings it back.
The city's requests changed. Districts stay inside the city, the nearest towns come
first, three at a time, and a town counts as connected with one change onto another
of your lines, within 1.6 times the drive.
The key stations stay on the map when the stations layer is off.
The bar, the layer list and the panels click when you press them. The Sounds
switch turns it off with the rest.
27 Aug 2026
A district disappears from the map once the city has paid you for it. Its card shows
one number: the share of its people who can walk to a stop.
A selected station says what the next click does: click it again to build from here,
or click an end station. The line list's hint says the same, and every guide page for a
mode explains how to continue a line from a station it already has.
A town's card says why it does not count as connected yet, and what would connect it:
the trip has to be on one line, under 1.6 times the drive, and a tram with forty stops
cannot do it where an express, a metro or a railway can.
A guide to the game: the question mark in the top bar opens eight short pages with
pictures. How to lay a bus, a tram, a metro and a railway, set the takt, change a line
and read the numbers.
26 Aug 2026
Tell the developer what you think: the bug in the top bar opens a feedback box.
Wishes, improvements, bugs, everything is welcome.
The card you share draws your network like a printed transit map: straight runs, soft
bends, clear station marks, upright names. The share dialog also downloads a big version
for posting.
Take a middle stop out of a bus line and the bus finds its way between the neighbours
again. Reserved track, rails and tunnels keep their alignment.
An interchange with platforms apart shows the sign at each platform and the walk
between them.
A bus or tram that joins a metro or rail station stops on the nearest street, and the
card says how far the walk is. A station the line already calls at cannot be joined
twice.
25 Aug 2026
The cities that are not open yet take votes: pick one in the city menu, see the four
maps, vote for the ones you would play.
Share this city draws a card of your network with its figures, gives you a short link,
and downloads the card as PNG or SVG. A chat shows the card for the link, and on a
computer the link opens the network in the game.
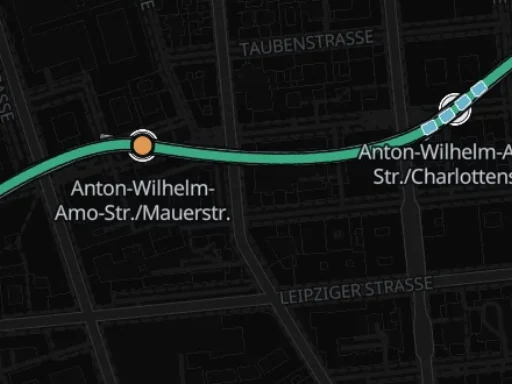
The people and jobs a station reaches are counted to its mode's walk: 500 m for a bus,
600 for a tram, 800 for a metro, 1,500 for a train. It was 800 m for every mode.
A place card beyond walking reach says so, instead of naming a stop kilometres away.
A stop along a street is named by its nearest crossing, Turmstr./Beusselstr., the way
real stops are. Stops you named yourself keep their names.
Every colour means one thing: red is a verdict, amber a warning, blue the plan, green
what a click would earn. Everything else is grey, and a selected control is brighter.
The layer bar is open on a first visit. The Takt mark in the top bar opens this page in
a new tab.
A line with one station shows it in its card, and the top bar counts it.
Take a station out with the × in its row. On a built line, Build removes it; a lone
station goes at once.
 Berlin
 Amsterdam
 Hong Kong
 New York




 Warsaw
 Istanbul
 Los Angeles