See what changed and choose what to build next
The Dashboard brings your yearly reports, network results, finances, and funding into one window. Start with the results, then choose a useful next project.
Open the Dashboard
Click the capital amount in the top bar. The Dashboard remembers your selected view. It starts on Overview before you choose another view.
Finishing a year opens its Year report. The report stays open until you close it or choose another view or action.
Press Esc, click the close button, or click the capital amount again to return to the map.
| Tab | Use it to answer | Which year? |
|---|---|---|
| Overview | Is the network improving, and which lines need attention? | The selected completed year |
| Finances | What did the service cost, and how did construction capital change? | The selected completed year |
| Year report | What changed, what happened, and which services need attention? | The selected completed year |
| Capital & funding | What can I afford, and which places could fund the next project? | The current planning year |
Year report: read what happened
The report explains passenger changes, walking access, satisfaction, and money. It records construction, service changes, grants, and permanent funding awards.
Read each line's account for crowding, running costs, and busy stations. Open Read the figures for the supporting values.
Names in the latest report open the current line, station, or measured stretch. Earlier reports retain their recorded names and results.
Use the year selector or Previous and Next to browse saved reports. Older records identify missing information.
Some timetable suggestions offer a test. Compare the measured result before adding the suggested change to your plan.
Find where overcrowding reduces satisfaction
The Year report lists the affected services and their recorded crowding. A finding can identify hours, a busy section, and its direction.
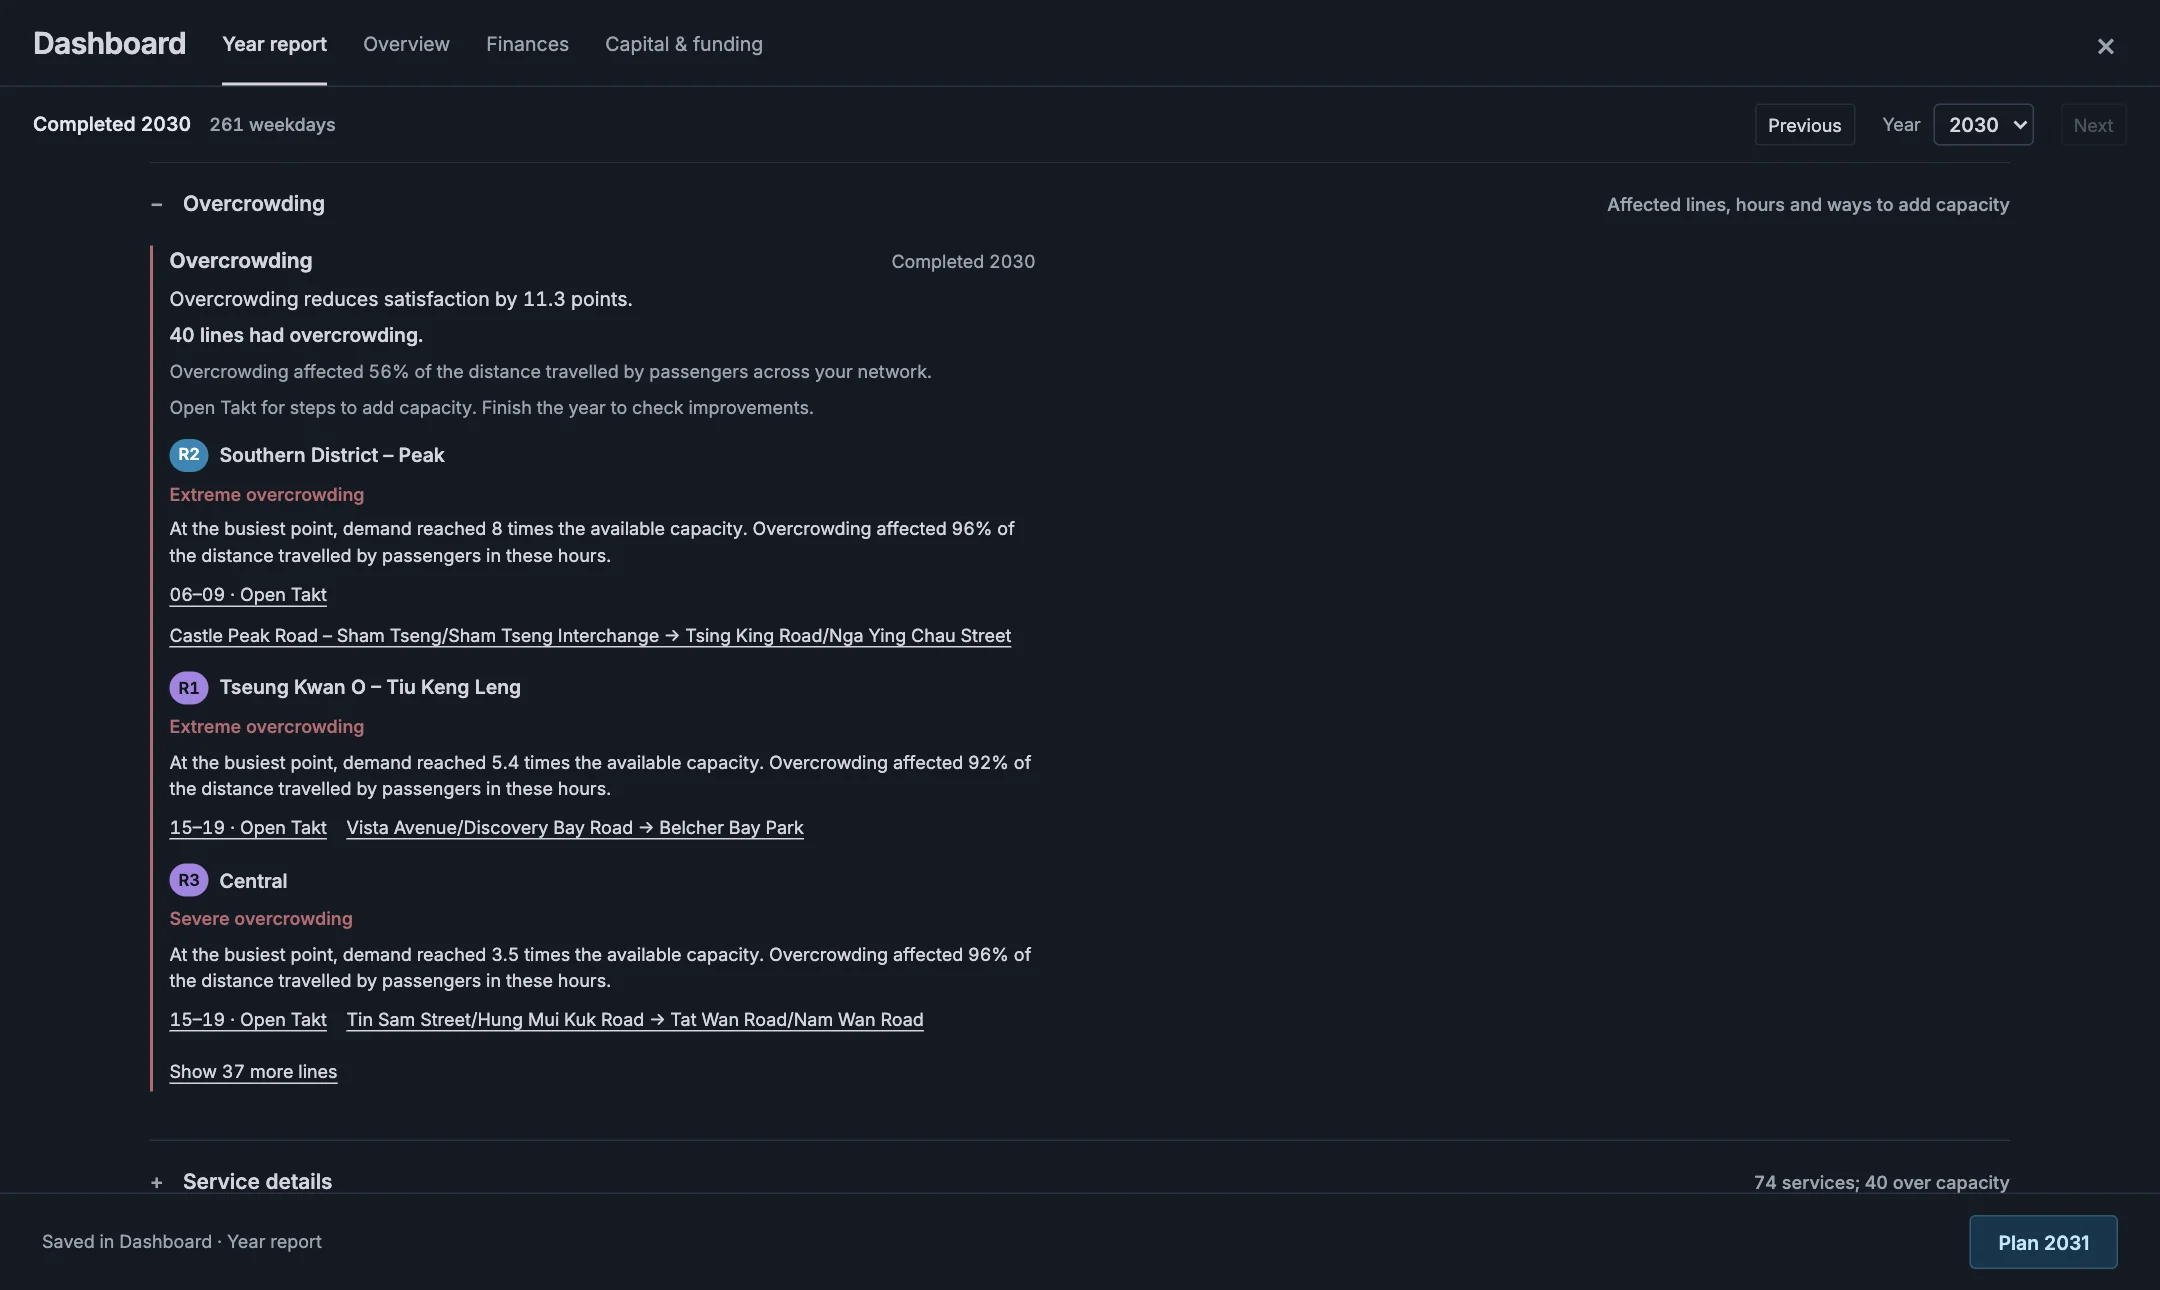
The report initially shows a short list. Expand it to inspect the remaining findings.
The share of passenger travel affected describes the extent of overcrowding. It is not a count of passengers refused boarding.
Earlier years keep their own evidence. An old record without a matched section or direction does not borrow that information from today.
The report marks the stronger satisfaction rule when it first applies. Use that notice before comparing scores across the change.
Overview: read the network
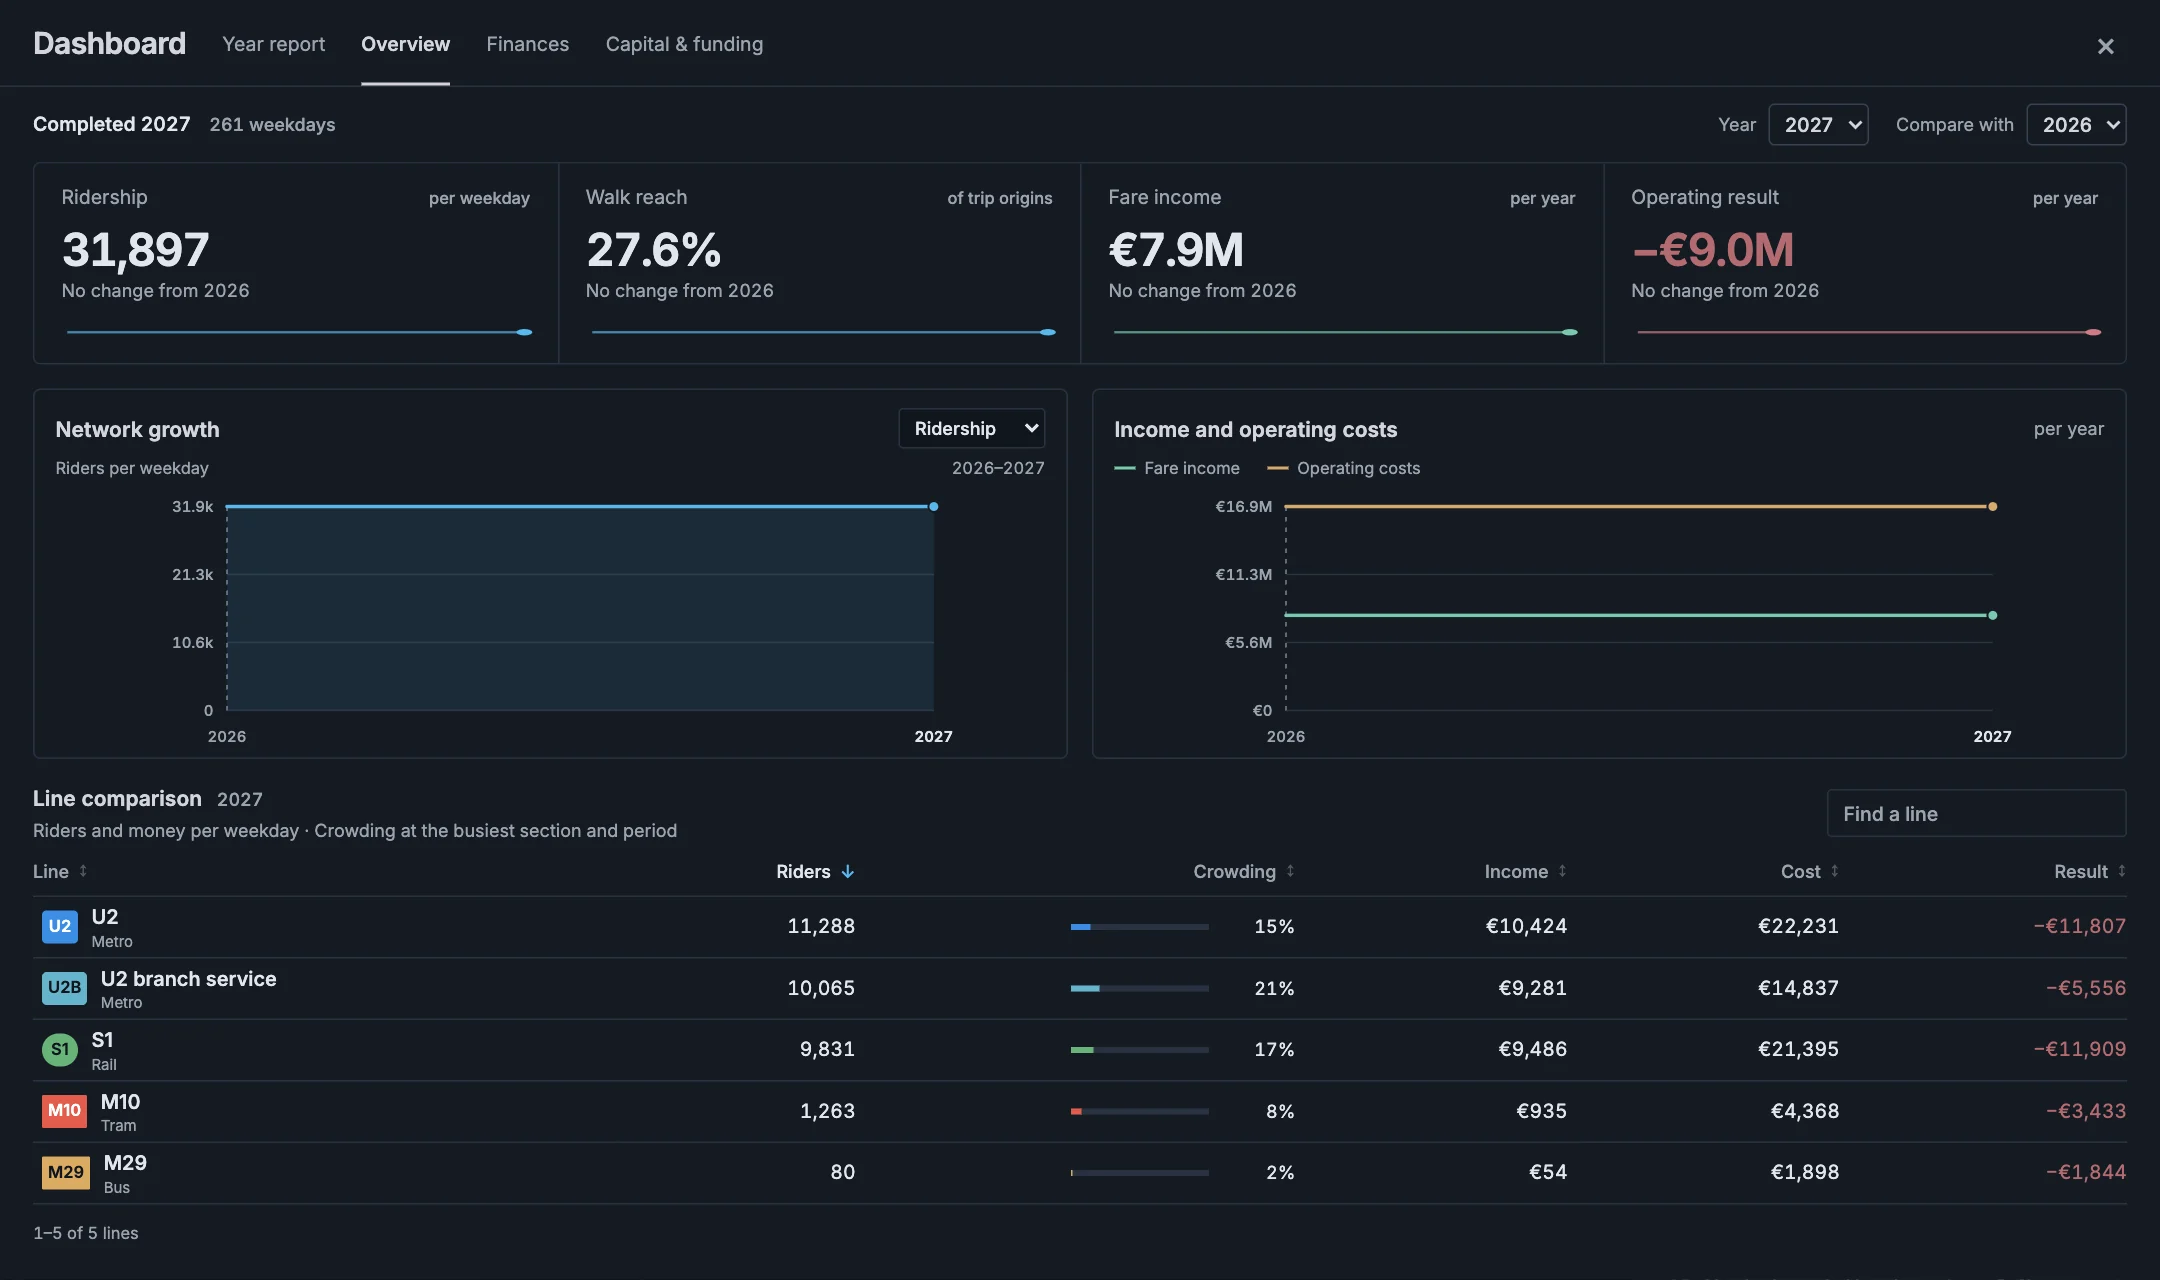
Year selects the completed year you want to inspect. Compare with selects an earlier year for the changes below the headline figures.
Changing either year only changes the view. It does not load an old game or replace your current plan.
| Headline | Meaning | Use it for |
|---|---|---|
| Ridership | Trips carried on an average weekday. An outward and return trip count separately. | Check whether the network attracts more trips. |
| Walk reach | The share of trip origins within walking distance of an operating stop. | Check whether more people can reach the network. |
| Fare income | Weekday fare income multiplied by the weekdays in that recorded year. | Compare annual fare income with annual operating costs. |
| Operating result | Annual fare income minus annual operating costs. | See the operating surplus or the subsidy the service needs. |
The small chart below each figure shows its recorded history. The change names the comparison year, so a change across several years is clear.
Walk reach changes use percentage points. For example, a rise from 40% to 45% is an increase of five points.
Walk reach is not the share of trips you carry. A nearby stop can still offer an unhelpful journey. Use ridership and service quality together.
Use the two charts
Network growth can show Ridership, Walk reach, Satisfied, Transfers, Districts, or Towns. Choose the measure beside its title.
Income and operating costs puts the two annual amounts on the same scale. The distance between the lines shows the operating gap.
Hover a year to read its values. Click the year on a chart to select its record. Keyboard focus also exposes the values.
The dashed comparison marker identifies the earlier year. The charts use stored results; years without a record have no value to inspect.
Compare lines
The line table describes the same completed year as the headline figures. Enter a name or code in Find a line, or click a column heading to sort.
| Column | What it shows |
|---|---|
| Line | The recorded line name, code, colour, and transport type. |
| Riders | Trips carried by the line per weekday. |
| Crowding | The fullest section at its busiest period. Above 100% means demand exceeds capacity. |
| Income | The line's fare income per weekday. |
| Cost | The line's operating cost per weekday. |
| Result | Weekday income minus weekday operating cost. |
Line money is per weekday. The headline money is per year. Do not compare these amounts without checking their units.
Use the arrows below the table to see more lines. Click a line name to open its details below the table.
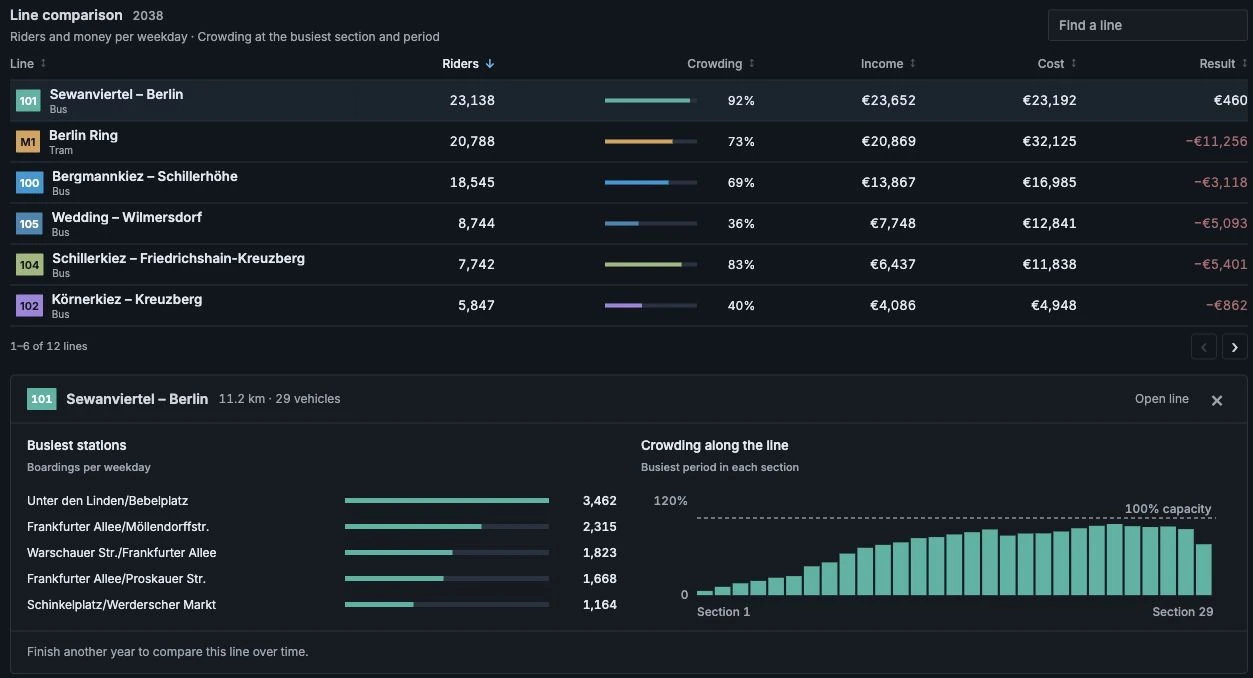
The latest completed result can show the five busiest stations and crowding along the line. The dashed line in the crowding chart marks 100% capacity.
A map sits beside the station and crowding charts. Point at a station or crowding bar to highlight its recorded place or section.
Expand Ridership history for this line when several years have recorded line results. Choose Open line to leave the Dashboard and open its line card.
Older saves can have network history without individual line history. Those years show a message instead of made-up line figures. Newly completed years record the line totals.
Station loads describe the latest completed result. An older year does not substitute today's station loads for missing historical detail.
Finances: separate service and construction
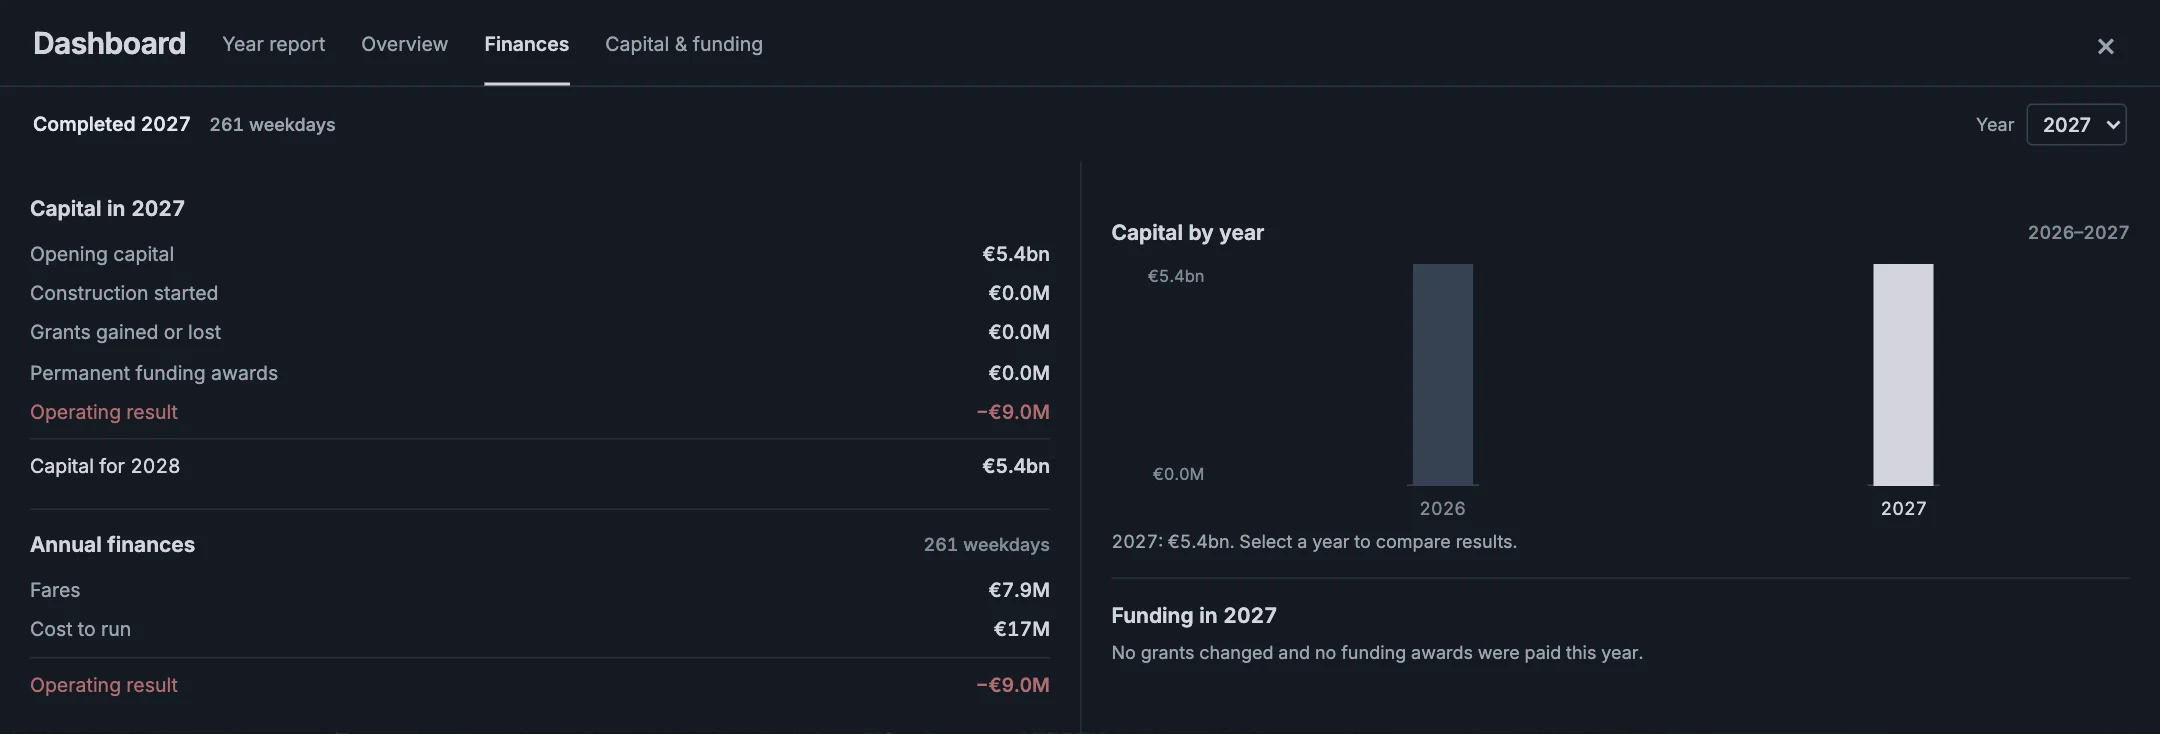
Year selects the completed record. The capital ledger shows the opening amount, construction started, grant changes, permanent awards, and capital for the following year.
Annual finances shows fares, the cost to run the service, and the operating result. The weekday count explains how the annual figures were calculated.
An operating loss does not use your construction capital. The city covers the operating subsidy. An operating profit also stays separate from the construction budget.
Use the capital history chart to compare recorded years. The funding list names grants gained or lost and permanent awards paid in the selected year.
A historical closing balance can differ from the amount in the top bar. The top bar reads the current budget, including money already reserved for projects.
Review the year plan
Click Plan YEAR or Finish YEAR in the top bar. A separate card lists construction projects and service changes.
The button says Finish YEAR when the year has work to apply. Review the card before confirming.
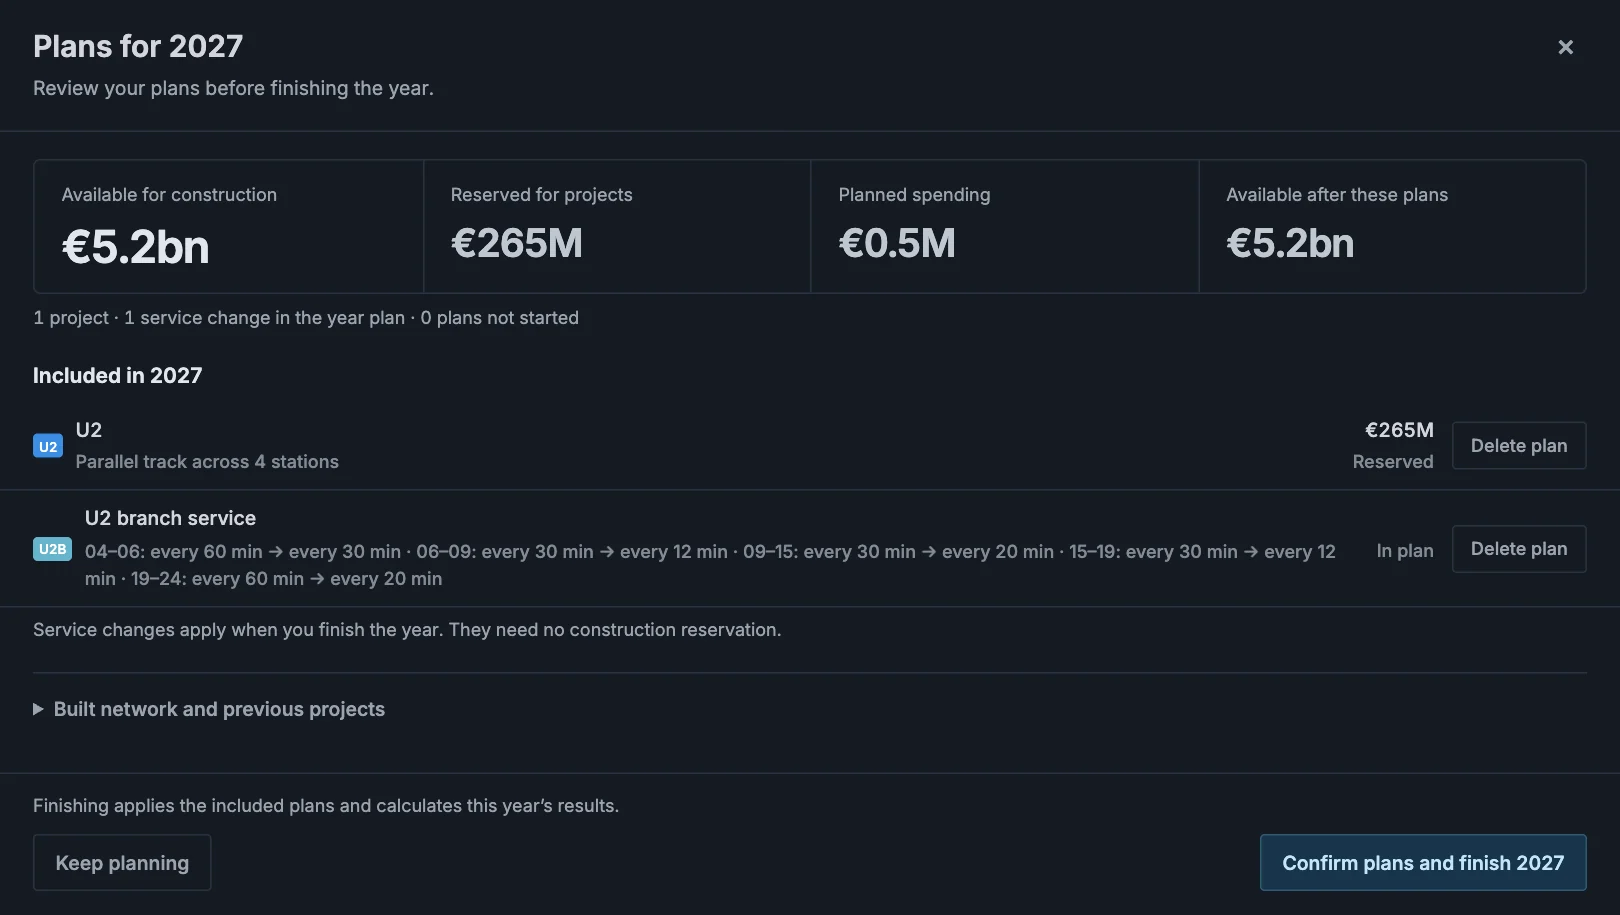
A project in the year plan has its complete construction cost reserved. A blueprint that you have not added to the plan does not reserve money.
Read each project's status and opening year. Descriptions distinguish extensions, shared or parallel track, rebuilt sections, loop closures, and longer platforms.
Click a row to return to its line card and edit the plan. New track cannot carry service before it opens.
To remove a listed plan, click Delete plan, then Sure? in the same row. Cancel keeps the plan.
Service changes need no construction reservation. Deleting a service change restores its previous service settings.
Choose Keep planning to return to the map. Confirm plans and finish YEAR applies the included plans and calculates the year's results.
If the year cannot finish, read the explanation directly below the confirmation button. It stays with the year plan.
The built-network section retains previous construction. The Year report records what started, continued, and opened in each completed year.
Capital & funding: choose the next place
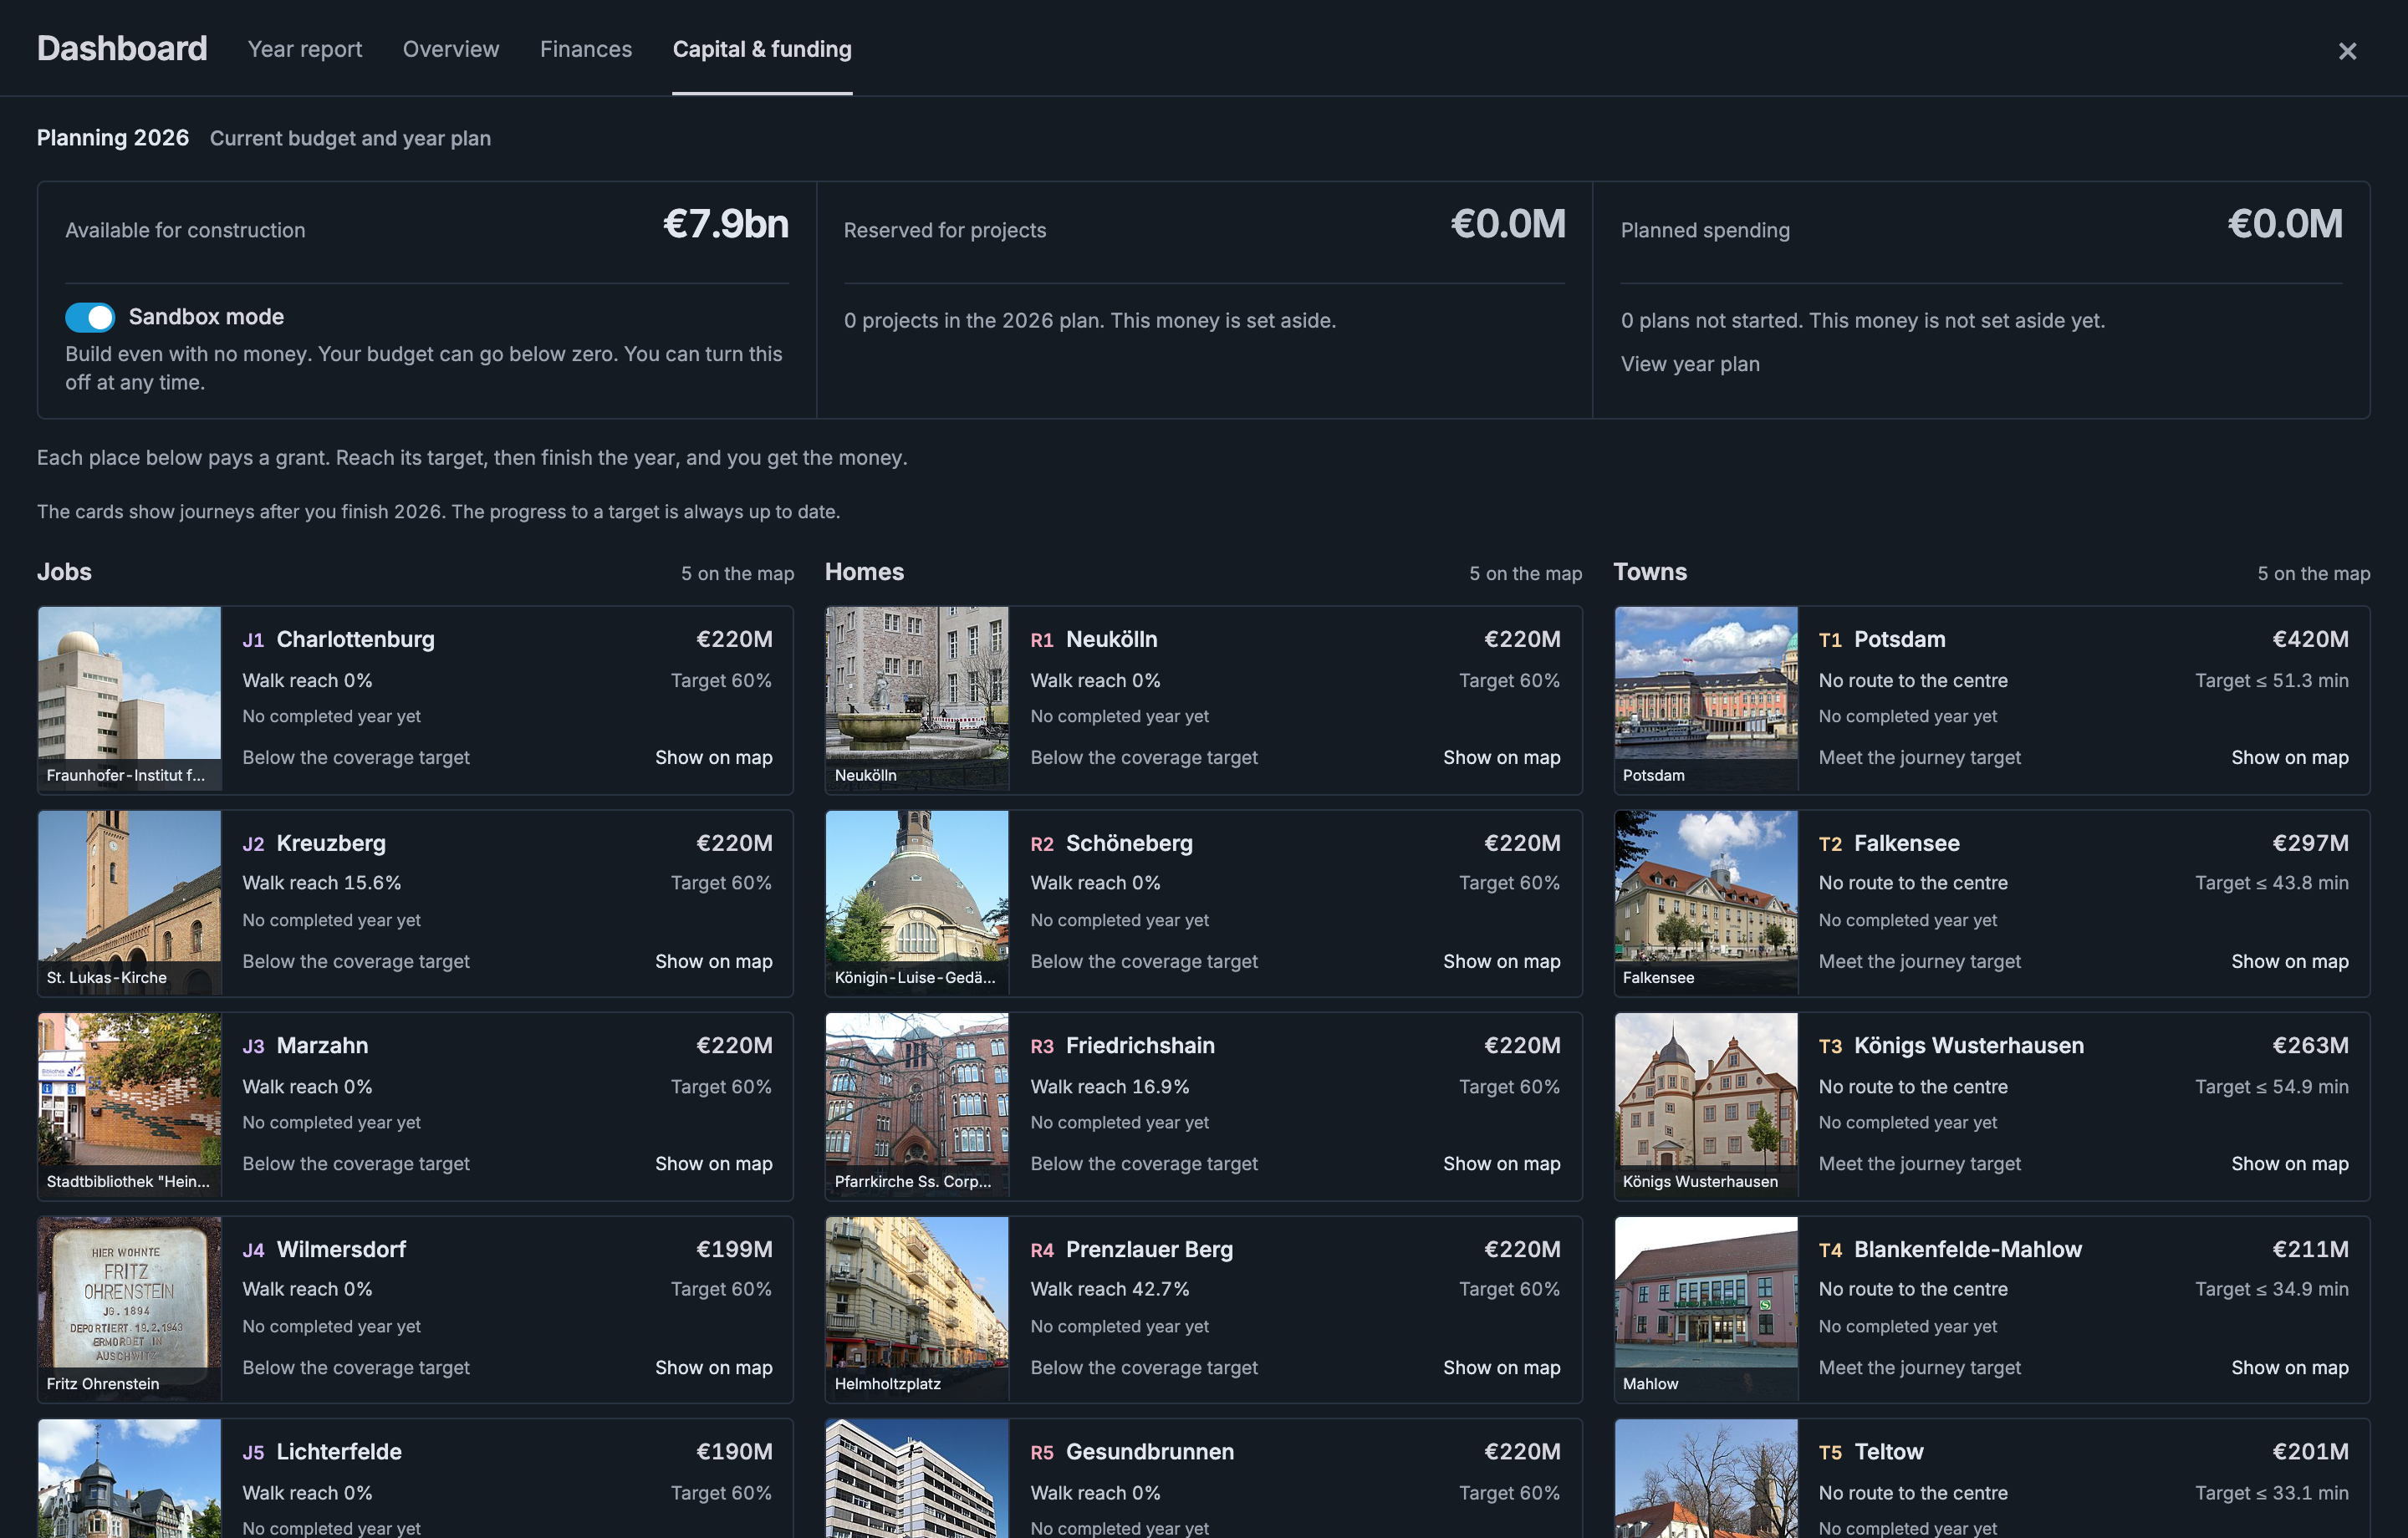
This tab always describes the current planning year. Selecting an old year elsewhere does not turn these targets into historical targets.
| Budget figure | Meaning |
|---|---|
| Available for construction | Money still available after built work and existing project reservations. |
| Reserved for projects | Money already set aside for projects in the year plan. |
| Planned spending | The cost of remaining blueprints that have not been added to the plan. |
| Available after these plans | What would remain after those blueprints. This appears when there is planned spending. |
Use Finish YEAR in the top bar to review the current plan.
Build beyond the budget with Sandbox mode
Sandbox mode lets you add construction even when the available money does not cover it. You can turn it on inside an existing game.
- Click the capital amount in the top bar to open the Dashboard.
- Choose Capital & funding.
- Turn on Sandbox mode under Available for construction.
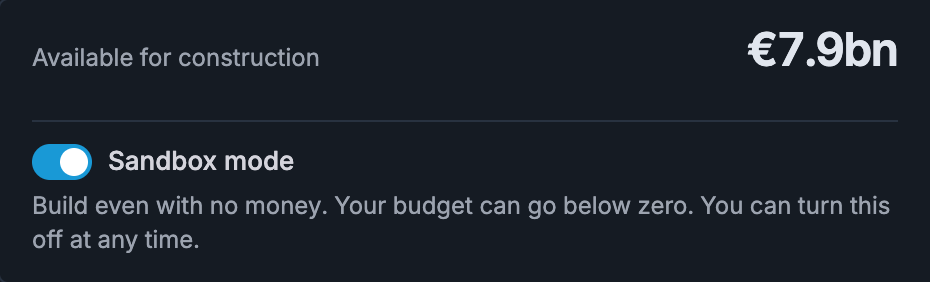
Costs still count. Your construction budget can go below zero, and the game shows the shortfall.
You still add construction to the year plan and finish the year. Construction times, track rules, timetable capacity, and passenger calculations still apply.
Turn the switch off at any time to require available funding again. Turning it off does not erase the shortfall.
The switch belongs to this game and is saved with it. Undo can also take back a switch change.
Read the place cards
Jobs, Homes, and Towns each show up to five current map targets. The J, R, and T numbers match the map labels.
Jobs and Homes show the measured walking coverage beside the 60% target. The progress bar fills as coverage approaches that target.
Towns show the complete journey time to Centre beside the required time. No journey yet means that the current network has no qualifying journey to compare.
The amount is the grant for meeting that card's target. It is not a fare-income forecast or the total of every future district grant.
Journeys per day counts trips from that district or town carried by your network. A transfer does not count as another journey.
Not offered yet means that the place is a map target without a current grant offer. The card shows no grant amount.
Click anywhere on a card to show the place on the map. A selected official boundary identifies the district or town; it does not show the part already within walking distance.
Build toward the target, add the work to the year plan, and finish the year. The city then assesses the operating network and pays qualifying grants.
A rounded percentage can look close to the target without meeting it. Read the status as well as the number. A value marked <60% is still below the target.
Open more detail when you need it
| Section | What you find |
|---|---|
| All remaining districts and towns | Search and sort beyond the leading targets, including earned grants and places without a current offer. |
| All funding details | Searchable districts, towns, permanent awards, eligibility conditions, and payment status. Filter by place or funding status, then expand a row. |
| Payment history | Funding held now and the recorded history of grants and awards. |
The five visible targets are suggestions, not a limit on district payments. Any eligible district can earn its grant when the year closes.
Some districts first require a connection to their parent town. All funding details names that town and shows the remaining coverage condition.
A grant at risk needs attention before year end. Restore the required service to keep it. Permanent awards remain earned after payment.
The city requests guide explains district coverage, town journeys, later funding awards, and the standard-fare condition.
Before the first completed year
A new game has no yearly trends yet. Overview shows the actual construction budget and the steps to build the first line.
Draw a line, add it to the year plan, and finish the year. The first recorded results then appear in the Dashboard.
Planning never replaces completed results. Use the planning-year labels for the work ahead and completed-year labels for what the model has already measured.