Rebuild a real city's transport
The city starts with no public transport. Plan a corridor, add it to the year plan, then finish the year. The exact demand model then shows every rider and trip that stays in a car.
Your first target
Carry 0.5% of the city's trips. The city will then vote more capital for your growing network.
Your network grows one year at a time. Plan projects, finish the year, read the exact result, and use the new capital.
To experiment beyond the construction budget, turn on Sandbox mode in the Dashboard.
Planning is instant. Draw and change the plan without waiting. Takt runs the complete demand model only when you finish the year.
Your score is the share of all city trips carried by your network.
Build your first bus line
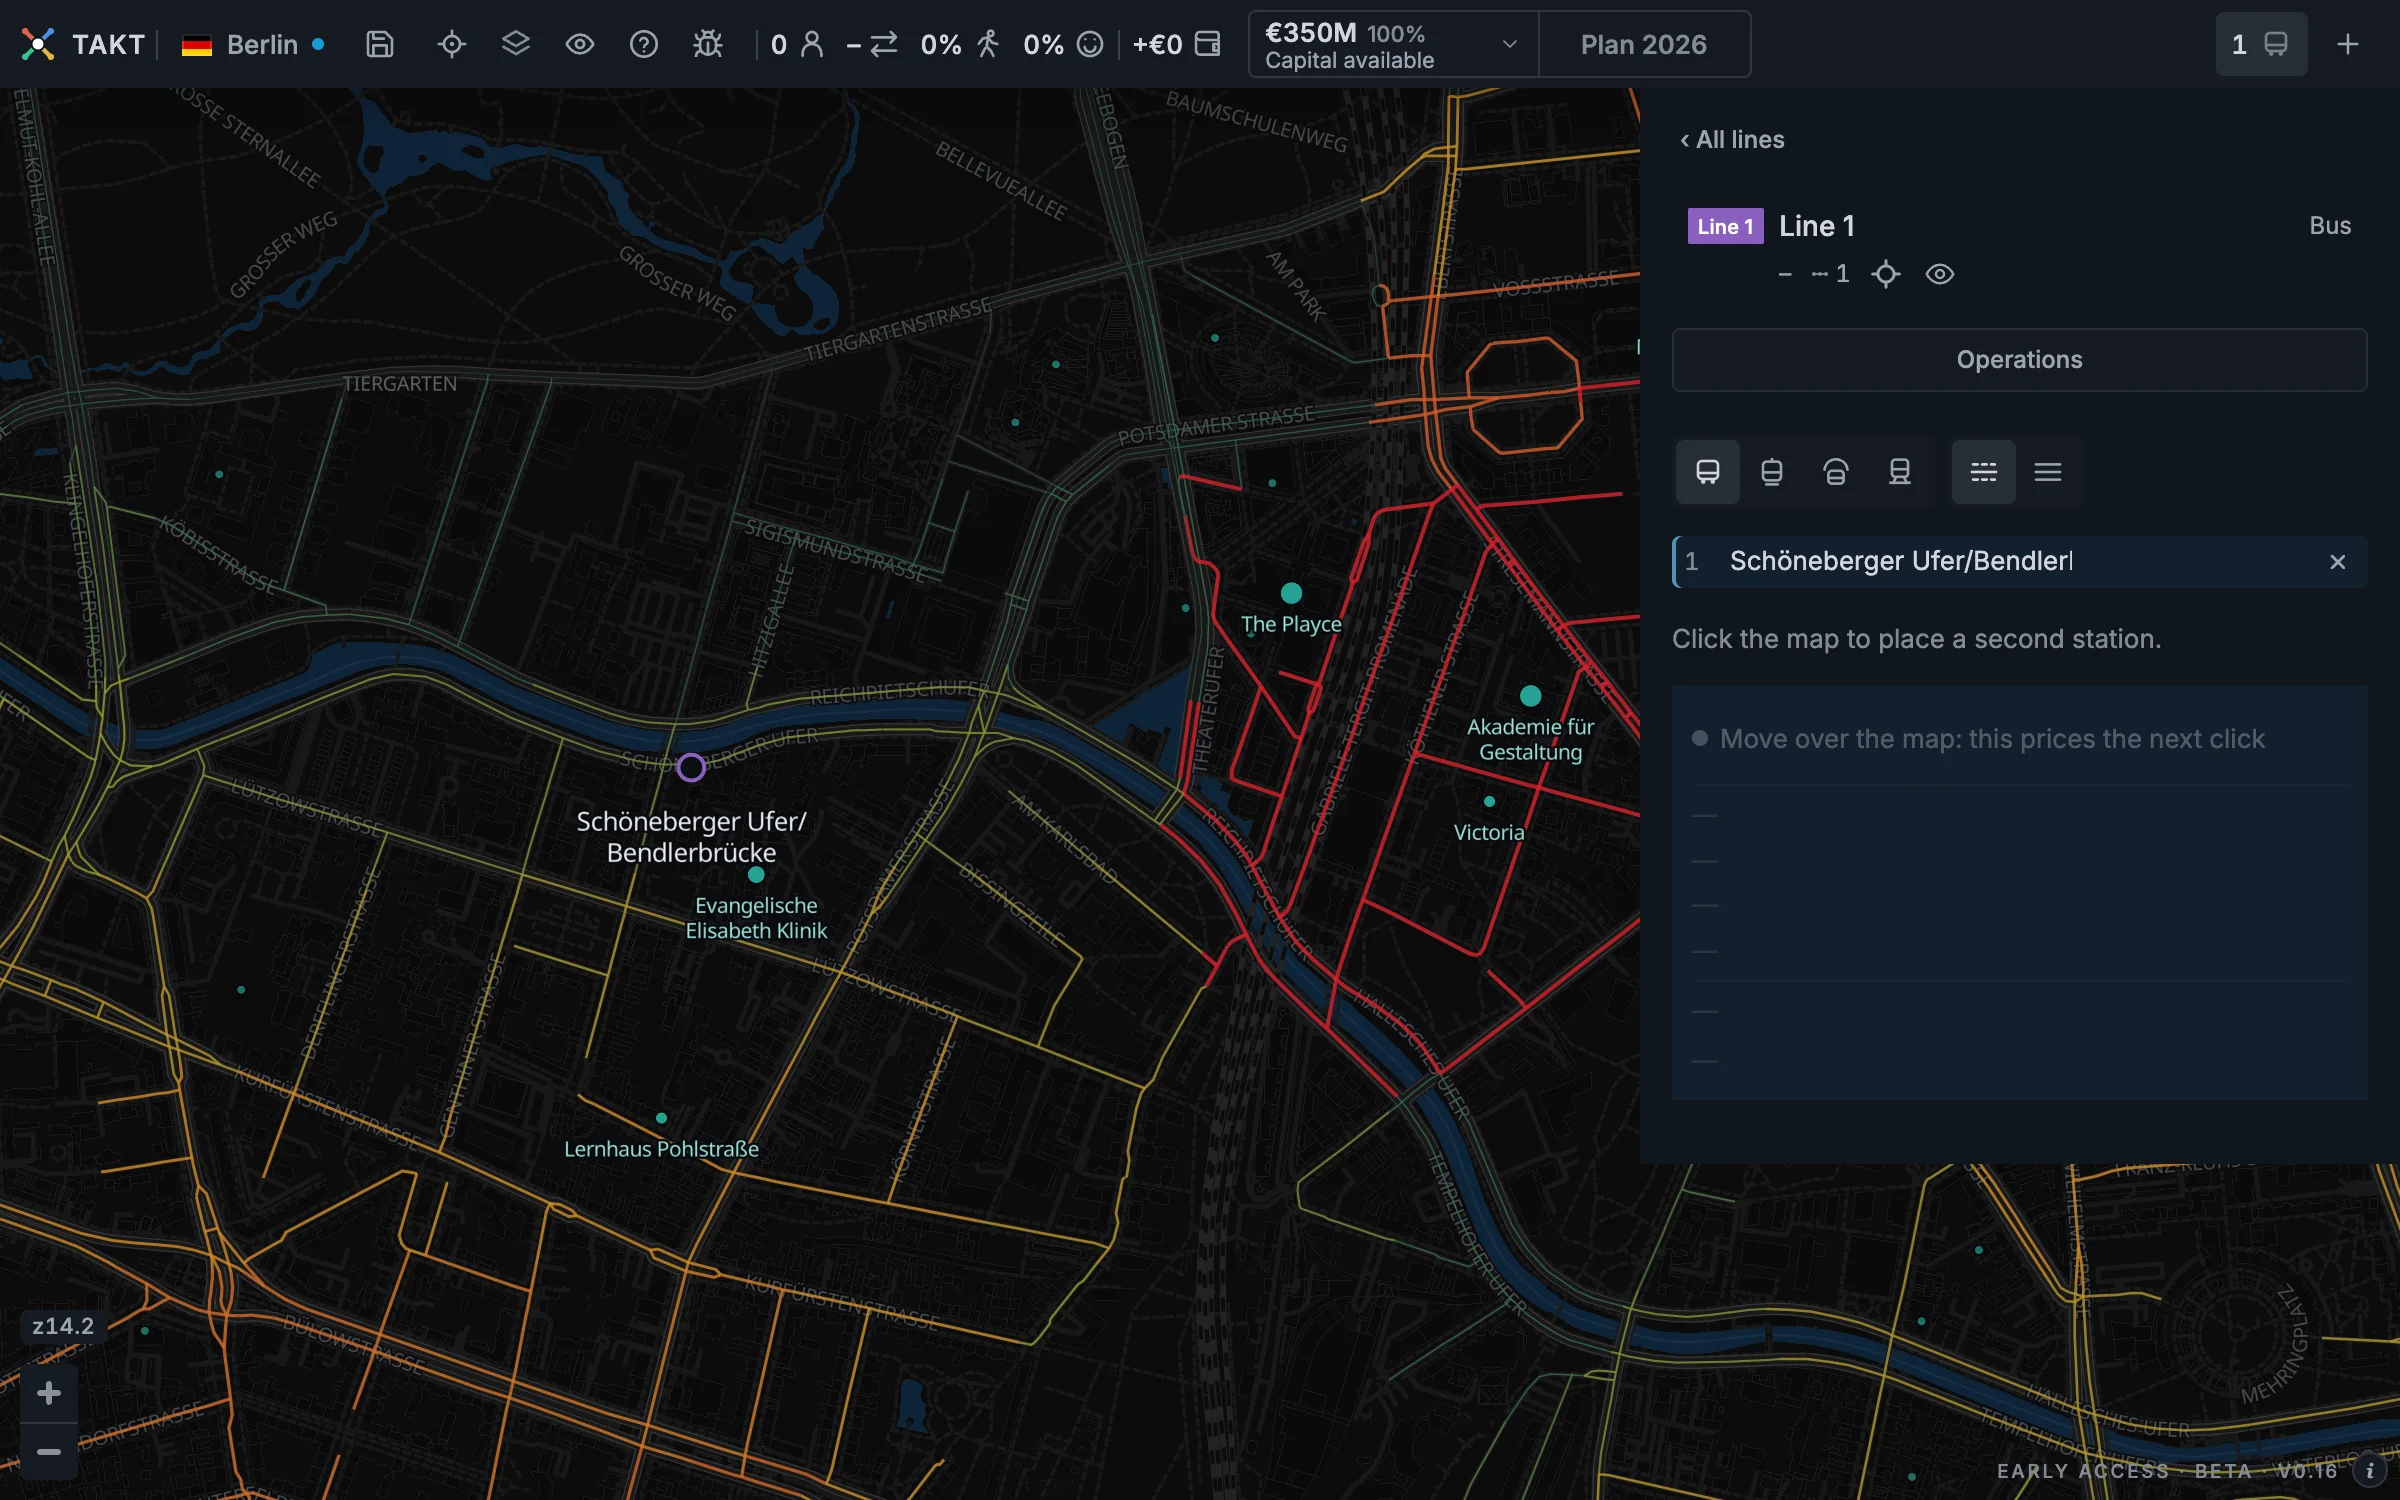
- Find a street with a strong red colour. Red shows where many trips are waiting.
- Press + beside the line list and choose Bus. A ghost follows the cursor.
- Click along the corridor to place five to eight stops. About 300 to 500 metres between stops is a good start.
- Press Esc when the line is long enough.
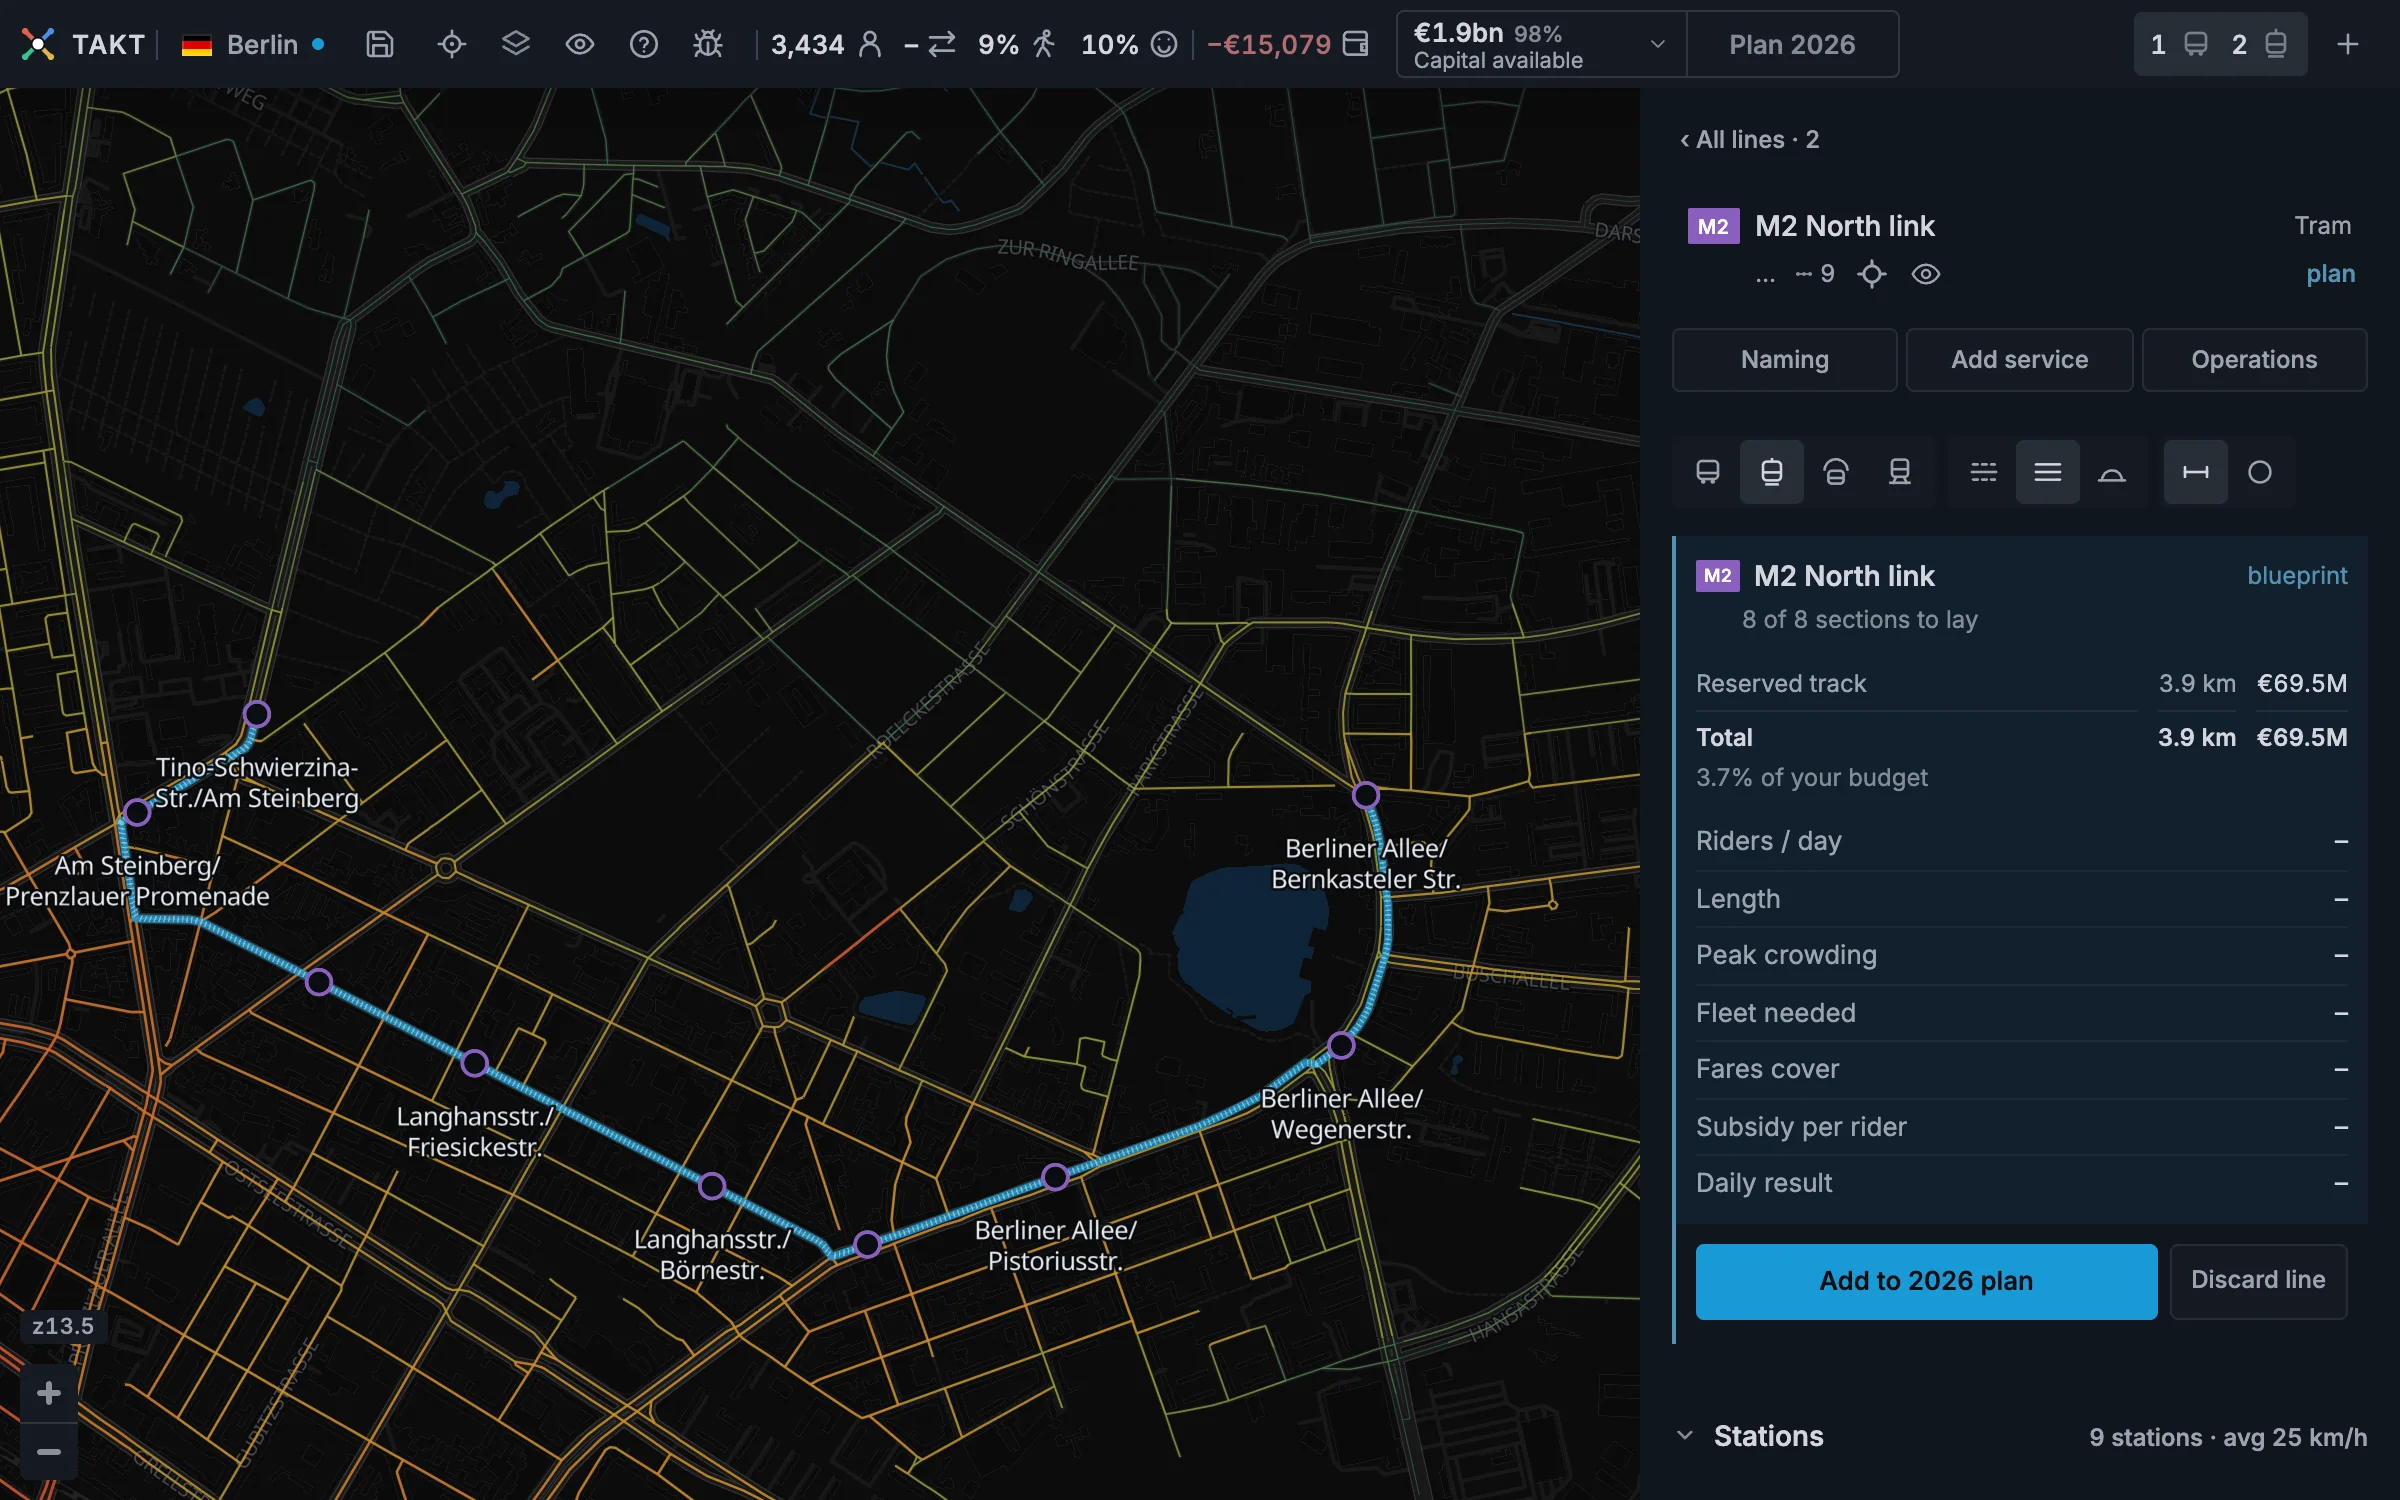
- Press Add to this year's plan on the card.
Press Finish YEAR beside the capital amount in the top bar. Review the plans, then press Confirm plans and finish YEAR.
Choose Keep planning to return to the map. Use Delete plan beside a plan to remove it before finishing.
In a new game, the button says Plan YEAR until you add a project. Click the capital amount to open the Dashboard.
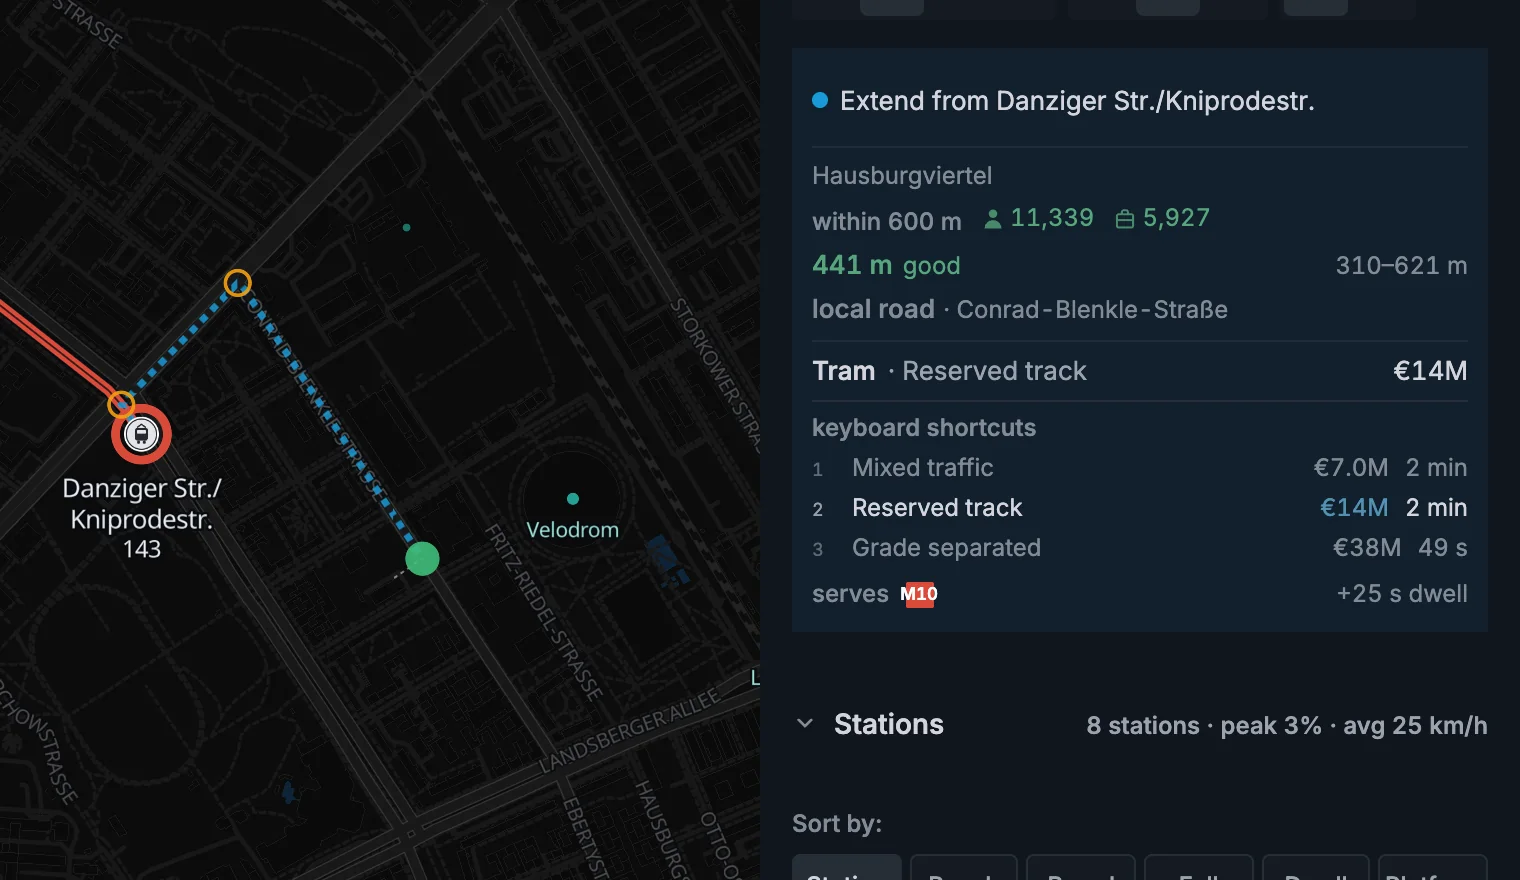
Just after a city opens, a price can show …. Takt shows the price when the buildings and the water are loaded.
Read what happened
The person icon in the top bar shows Riders / day. This is the average weekday result from the last closed year.
Each number opens its own details. Hover an icon to read its label, or use Read the numbers.
After the year closes, the top-bar figures update and the Year report opens. It explains the results and funding changes.
Use Overview to compare completed years. Capital & funding shows the next map targets.
- Faded streets show trips that your network now carries.
- Strong colours show demand that is still waiting for a useful service.
- Amber or red takt columns show busy or overcrowded vehicles. Read the advice before choosing more capacity.
Read the map explains demand, speed, station use, transfers, frequency, and track capacity. Set the takt explains frequency and crowding.
For a clear overview of your services, open Network view. Follow shared routes and select lines from their station badges.
Build the next corridor
You do not need to design the whole network first. Build one corridor, read the result, and improve what the model shows you.
- Bus tests a corridor cheaply.
- Tram adds capacity to a busy street corridor.
- Metro carries the strongest urban corridors away from traffic.
- Railway connects distant towns and outer districts.
Change a line
Click a station once to select its line and mark the station. Click the same station again to build from it. Right click and Esc step back, while Ctrl Z or Cmd Z takes the last edit back. Change a line explains every edit.
Removing a station changes the visible plan immediately. You can remove a terminus and extend the new end before finishing the year.
After loading a city, open the line list to see the whole network. Select a line there to read its card.
Keep your progress
Takt saves the current city in this browser. The save icon opens Saved games, with separate controls for saving and loading.
You can also save a timetable by name and use it on other lines.
Save and share explains recovery copies, game files, and continuing an existing Amsterdam game on the updated map.
Ready to plan? Open Berlin, find one red corridor, and see what your first line can win.